The AI-Native Finance Catalog: Pricing, Forecasting, and Financial Architecture for AI Companies
If you're new to all this — start here
This is a long document. You do not need to read it all to start using it. If you are new to finance, or running an early-stage AI company, here is the simplest possible answer to "what should I do?"
This week. Set up Stripe (or equivalent) to handle billing. Connect it to a simple bookkeeping tool — Pilot, Bench, Puzzle, Mercury Treasury, or something similar that automates the basics. Track three numbers from this point forward: revenue, gross margin (revenue minus the cost of compute and any other usage-based vendor costs), and cash runway in months.
This month. Build a simple spreadsheet with one row per month for the next 18 months, projecting those same three numbers forward. Update it on the first business day of every month. Compare actuals to forecast every month. The discrepancies are where you will learn what your business actually does.
This quarter. Once you have three months of revenue data, look at the average gross margin. If it is below 50%, your unit economics are likely broken — most AI-native businesses need 60%+ gross margin to survive at scale, and SaaS norms expect 75–85%. Below 50% is a signal to investigate compute costs, vendor pricing, or whether your pricing model fits your cost structure.
This year. Do not hire a CFO. Do not hire an accounting team. Do not buy enterprise FP&A software. Do not run an audit unless an investor explicitly requires one. Use the time you save to grow revenue, because most of finance only matters once you have meaningful revenue to manage.
That is the entire prescription for the first 12 months of an AI-native company. Stripe + a bookkeeping tool + three numbers + a simple forecast spreadsheet. The rest of this document is for the moment you outgrow that setup — when your revenue model gets complex enough, your investors get demanding enough, or your team gets large enough that the simple stack stops scaling.
If you want a slightly broader overview before returning to the prescription above, the Beginner's 10-minute version below gives you the wider map.
The beginner path through this document
If you are a true beginner, do not read this document linearly. The catalog is built for many readers — founders, CFOs, controllers, investors — and most of it is not for you yet. Read these five sections, in this order, and skip everything else until you have actual revenue:
- If you're new to all this — start here (above) — the literal year-one prescription.
- Beginner's 10-minute version (below) — the broader picture: four families, twelve approaches in one sentence each.
- Approach 2 — Per-Call / Usage Pricing (in Section A) — the most common AI pricing model and the one you will likely run first.
- Approach 7 — Compute COGS Accounting (in Section B) — what every founder needs to understand about gross margin in AI businesses.
- Appendix A — Glossary (at the end) — open this whenever a term is unfamiliar.
That is the entire beginner reading path. Roughly 4,000 words across five sections. You can skip the executive summary, the finance diagnostic, the strategic fit matrix, the other ten approaches, the cross-cutting concepts, the AI-era shifts, the common failures, and the anti-patterns until you have specific questions those sections happen to answer.
After you have meaningful revenue (typically $1M+ ARR), come back to the document and read the rest in whatever order interests you.
Where this document fits
This document sits inside The AI-Native Company series. The Agent Factory Thesis defines the architecture. The AI Worker Catalog defines what gets built. The Sales Catalog and The Marketing Catalog cover how the company sells and creates demand. The Finance Catalog defines how the company keeps the books, prices its products, forecasts the future, and reports to the people who fund it.
This document answers an operational question: how do you actually run the financial side of an AI-native company, given that the cost structure, the pricing models, and the forecasting problems are meaningfully different from traditional SaaS?
You can read this document standalone. The few cross-references to the Sales Catalog (where pricing motions are introduced) can be skipped without losing the argument.
How to read this document
This document is a tool, not a story. Different readers will use it differently.
If you are new to finance. Follow the Beginner path through this document above. Do not try to read the whole catalog on first pass — most of it is not for you yet.
If you are a founder running an early-stage AI company. Use the Finance Diagnostic and the Strategic Fit Matrix below to find which pricing architectures fit your buyer and stage. Read the relevant approaches in Section A. Skip the deeper accounting and forecasting sections until you have revenue worth forecasting.
If you are a CFO, controller, or finance lead at an AI company. The document is built for you. Read top to bottom. The approaches are sequenced from pricing (the most common entry point) through accounting mechanics, forecasting, and external reporting.
If you are an investor or board member. The Investor & Board Reporting approach (Section D) and the Common finance failures section near the end are most directly relevant.
One note on jargon. This document uses technical vocabulary from accounting, FP&A, and SaaS finance. The first time a specialized term appears, it is usually explained in plain language nearby. Appendix A: Glossary gives a quick reference. The "Finance terms you must know first" section below covers the fifteen most important terms you will encounter.
Note on professional advice. This document provides strategic frameworks and operational reference, not professional accounting, tax, legal, or financial advice. Revenue recognition under ASC 606, capitalization of training costs, audit treatment, sales tax, and corporate-structure questions all require qualified professional guidance for your specific situation. Engage qualified professionals for material decisions; this catalog is a starting point for the conversations, not a substitute for them.
Note on confidence tagging. Throughout the document, individual benchmark claims and numerical ranges are sometimes tagged to signal how confident the reader should be in the specific number. [Industry benchmark] claims have broad practitioner consensus and are widely cited across SaaS finance literature (LTV/CAC > 3; mature SaaS gross margins 75–85%; Burn Multiple under 1.5× as the healthy SaaS bar). [Emerging pattern] claims have been observed across multiple AI-native companies in 2024–2026 but are not yet codified in canonical references (AI-native gross margins of 50–70%; compute as 20–60% of revenue; foundation-model price decay of 30–60% per year). [Author thesis] claims are informed extrapolations from observed patterns; the reader should treat them as one perspective rather than settled fact (specific cost-per-outcome ranges in worker cards; stage-by-stage employee productivity benchmarks; per-modality compute cost ranges). Untagged numerical claims sit somewhere within this spectrum; the tagging is selective rather than exhaustive.
Beginner's 10-minute version
If you only have ten minutes, read this section. It gives you everything you need to understand how AI-native companies handle finance — without the depth of the rest of the document.
What is "AI-native finance" and how is it different from regular SaaS finance?
AI-native finance is the practice of pricing, accounting, forecasting, and reporting for companies whose products use foundation models, AI agents, or other compute-intensive AI workloads. It differs from traditional SaaS finance in three important ways. First, cost structure: traditional SaaS has 75–85% gross margins because hosting costs are tiny relative to revenue [Industry benchmark]; AI-native companies typically have 50–70% gross margins because compute is a meaningful share of cost [Emerging pattern]. Second, pricing models: traditional SaaS sells per-seat subscriptions; AI-native companies frequently use per-call, per-token, per-outcome, or hybrid pricing because the cost-of-service varies with usage. Third, forecasting complexity: traditional SaaS forecasts can assume stable unit costs; AI-native forecasts have to account for foundation-model prices that fall 30–60% per year [Emerging pattern], customer ramp curves that are usage-driven rather than seat-driven, and contract structures that recognize revenue differently.
The four families of finance approaches
This document organizes twelve approaches into four families:
- Pricing architectures (1–5). How AI companies charge customers. Examples: per-seat (traditional), per-call (the AI infrastructure standard), per-outcome (service-as-software), value-based (percentage of measured customer value), or hybrid combinations.
- Revenue & cost mechanics (6–8). How AI companies account for what they earn and spend. Examples: revenue recognition for usage-based contracts, compute COGS treatment, cohort analysis with model-cost decay.
- Planning & capital allocation (9–11). How AI companies forecast and budget. Examples: pilot-economics modeling, revenue forecasting under falling compute costs, capital allocation between compute and people.
- External reporting (12). How AI companies talk to investors, boards, and auditors. Examples: investor metrics, board dashboards, audit-defensible disclosures.
The twelve approaches in one sentence each
- Per-Seat Pricing. Charge a fixed monthly fee per user; familiar from traditional SaaS, increasingly inappropriate for AI products with variable compute costs.
- Per-Call / Usage Pricing. Charge per API call, per token, or per query; the dominant pricing model for AI infrastructure and the most common starting point for AI products.
- Per-Outcome Pricing. Charge only when the AI delivers a defined result — a resolved support ticket, a processed claim, a booked meeting.
- Value-Based Pricing. Charge a percentage of measured customer value created; reserved for strategic enterprise deals with sophisticated buyers.
- Hybrid Pricing. Combine multiple architectures: a base subscription plus usage overages, or a subscription plus outcome bonuses.
- Revenue Recognition for AI Contracts. The accounting rules (ASC 606) that determine when revenue counts on the books, made more complex by usage-based and outcome-based contracts.
- Compute COGS Accounting. How to treat the cost of foundation-model API calls, GPU rentals, and infrastructure compute on the income statement.
- Cohort Analysis with Model-Cost Decay. Tracking how customer cohorts get more profitable over time as foundation-model costs fall.
- Pilot Economics & Contract Mechanics. Accounting for paid pilots, expansion to production contracts, and the multi-stage commercial structure most enterprise AI deals use.
- Revenue Forecasting Under Falling Compute Costs. Building 12–24 month revenue and gross-margin forecasts that explicitly model 30–60% annual compute price reductions.
- Capital Allocation. Deciding how to split incremental dollars between compute, people, marketing, and runway.
- Investor & Board Reporting. Designing metrics, dashboards, and disclosures that AI-native investors and boards expect — which differs meaningfully from traditional SaaS norms.
Beginner difficulty per approach
- Easy (intuitive, common starting point): Per-Seat Pricing (1), Per-Call Pricing (2)
- Medium (requires operational discipline): Per-Outcome Pricing (3), Hybrid Pricing (5), Revenue Recognition (6), Compute COGS (7), Pilot Economics (9), Capital Allocation (11), Investor Reporting (12)
- Advanced (requires sophisticated finance function or external advisors): Value-Based Pricing (4), Cohort Analysis (8), Forecasting Under Falling Costs (10)
That is the entire document in ten minutes. The rest explains each piece in detail and gives you the tools to choose, sequence, and run the financial architecture of your own AI company.
Finance terms you must know first
If finance is unfamiliar territory, these are the fifteen terms you will see most often in this document. Once you know what these mean, the rest of the document becomes navigable without constant glossary lookups. (For the comprehensive glossary covering all fifty-plus terms used in the catalog, see Appendix A at the end.)
Revenue. Money the company earns from customers. The top line of the income statement.
Bookings. The total contract value of deals signed in a period. Differs from revenue: a $1.2M one-year contract is $1.2M in bookings on the day signed but produces $100K of revenue per month over the contract term.
Recognized revenue. The portion of contracted revenue that hits the income statement in a given period under GAAP rules. For traditional subscription contracts, recognized revenue is bookings divided by contract length; for AI-native usage- and outcome-based contracts, the two diverge meaningfully.
ARR (Annual Recurring Revenue). The annualized contract value of subscription customers. The single most-tracked SaaS metric. A customer paying $10K/month on an annual contract contributes $120K of ARR.
COGS (Cost of Goods Sold). The direct costs of delivering the product to customers. For AI-native companies, COGS includes foundation-model API costs, hosting and infrastructure, and the variable customer-success time required to deliver the service. Compute is typically the largest line item.
Gross margin. Revenue minus COGS, expressed as a percentage of revenue. The most important profitability metric. Traditional SaaS norms are 75–85%; AI-native norms are 50–70% because compute is a meaningful share of cost.
NRR (Net Revenue Retention). The percentage of recurring revenue retained from existing customers including upsell. Above 100% means the existing customer base is growing in revenue terms. A 130% NRR means $1M of revenue from a year ago is now $1.3M from the same customers.
CAC (Customer Acquisition Cost). The fully-loaded cost to acquire one new customer — sales spend, marketing spend, and any other functions that contribute to acquisition.
LTV (Lifetime Value). The total gross-margin contribution a customer is expected to produce over their lifetime as a customer.
LTV/CAC ratio. Lifetime value divided by acquisition cost. Healthy SaaS programs target above 3×.
CAC payback period. The number of months required for a customer's gross-margin contribution to repay the cost of acquiring them. Mature SaaS targets under 18 months.
Cash runway. The number of months the company can fund operations at current burn rate before running out of cash. The most fundamental finance metric for early-stage companies.
Burn rate. Net cash leaving the company per month, typically operating expenses minus revenue collected. A company spending $500K/month and collecting $200K/month has a burn rate of $300K/month.
Burn Multiple. Cash burned divided by net new ARR added in the same period. Lower is better; under 2× is healthy for AI-native; under 1.5× is healthy for mature SaaS. Popularized by David Sacks.
Compute COGS. The cost of running AI workloads — foundation-model API calls, GPU inference, infrastructure compute. Treated as a primary line within COGS for AI-native companies, often 20–60% of revenue.
ASC 606. The US accounting standard governing revenue recognition. Determines when revenue counts on the books, particularly important for AI-native companies with usage-based and outcome-based contracts. International equivalent: IFRS 15.
These fifteen terms appear hundreds of times across the document. The remaining vocabulary (variable consideration, deferred revenue, contribution margin, capital efficiency ratio, Rule of 40, audit defensibility) builds on these. If you understand the fifteen above, you can read the rest of the document.
Minimum financial metrics for AI-native companies
If you track only ten metrics, track these. The table below is the simplest possible scorecard for an AI-native company at any stage — the metrics that determine whether the business is viable, the formulas to calculate them, and the targets you should be aiming for. Section E and Section F give the comprehensive metric set; this table is the floor, not the ceiling.
| # | Metric | Formula | Why it matters | Target |
|---|---|---|---|---|
| 1 | Revenue (recognized) | Sum of revenue earned in the period under GAAP rules | The top line; what the income statement reports | Growing month-over-month |
| 2 | ARR | Annualized recurring revenue from subscription contracts | The standard SaaS scale metric | Stage-dependent |
| 3 | Gross margin | (Revenue − COGS) / Revenue | Whether the unit economics work | 50–70% AI-native, 75–85% mature SaaS |
| 4 | Compute as % of revenue | Compute COGS / Revenue | The AI-specific cost ratio | 20–35% at scaling stage |
| 5 | Cash on hand | Total liquid cash at period end | Survival metric | At least 18 months of runway |
| 6 | Monthly burn | Operating expenses − revenue collected | The drain on cash | Stage-dependent |
| 7 | Cash runway | Cash on hand / Monthly burn | How long survival is funded | 18+ months |
| 8 | NRR | (Starting ARR + Expansion − Churn − Contraction) / Starting ARR | Existing customer health | >110% healthy, >130% strong |
| 9 | CAC payback period | CAC / (Monthly recurring revenue per customer × Gross margin) | How long to break even on acquisition | <18 months |
| 10 | Burn Multiple | Net cash burned / Net new ARR added | Capital efficiency in growth phase | <2× AI-native, <1.5× mature SaaS |
Track these weekly (cash, runway), monthly (revenue, ARR, gross margin, compute %, NRR, burn), and quarterly (CAC payback, Burn Multiple). Update from your bookkeeping tool; do not maintain in a spreadsheet that diverges from the books.
If you track these ten metrics consistently, you have the operational discipline to know whether the business is healthy and the credibility to talk to investors. Everything else in this document is supplementary depth.
Executive summary
The AI-Native Finance Catalog is a recipe book for handling the financial side of an AI-native company in 2026 and beyond. There are many ways to price, account for, forecast, and report on an AI business, and the right way depends on your buyer, your stage, your contract structure, and your investor expectations. This document names twelve approaches, organizes them into four families, and tells you which fit your situation.
The four families — what each kind of approach is for.
Pricing architectures (Approaches 1–5) define how the company charges customers. The choice cascades through everything else — revenue recognition, forecast complexity, sales-team compensation, customer-success focus. Most companies start with one architecture and evolve toward hybrid as they scale.
Revenue & cost mechanics (Approaches 6–8) define how the company accounts for what it earns and spends. The technical work of finance lives here: turning customer activity into auditable books, classifying compute costs correctly, and maintaining the cohort discipline that surfaces unit-economics truth.
Planning & capital allocation (Approaches 9–11) define how the company looks forward. Forecasting an AI business requires modeling not just revenue ramp but also falling compute costs, expanding usage, and the customer behavior changes that come with shifting AI capability. Capital allocation determines how dollars are split between the company's three main cost centers: compute, people, and customer acquisition.
External reporting (Approach 12) defines how the company talks to its investors, board, and auditors. AI-native companies report on metrics traditional SaaS does not: model cost as percentage of revenue, gross margin including compute, contribution margin per outcome, and forecast accuracy adjusted for model-price decay.
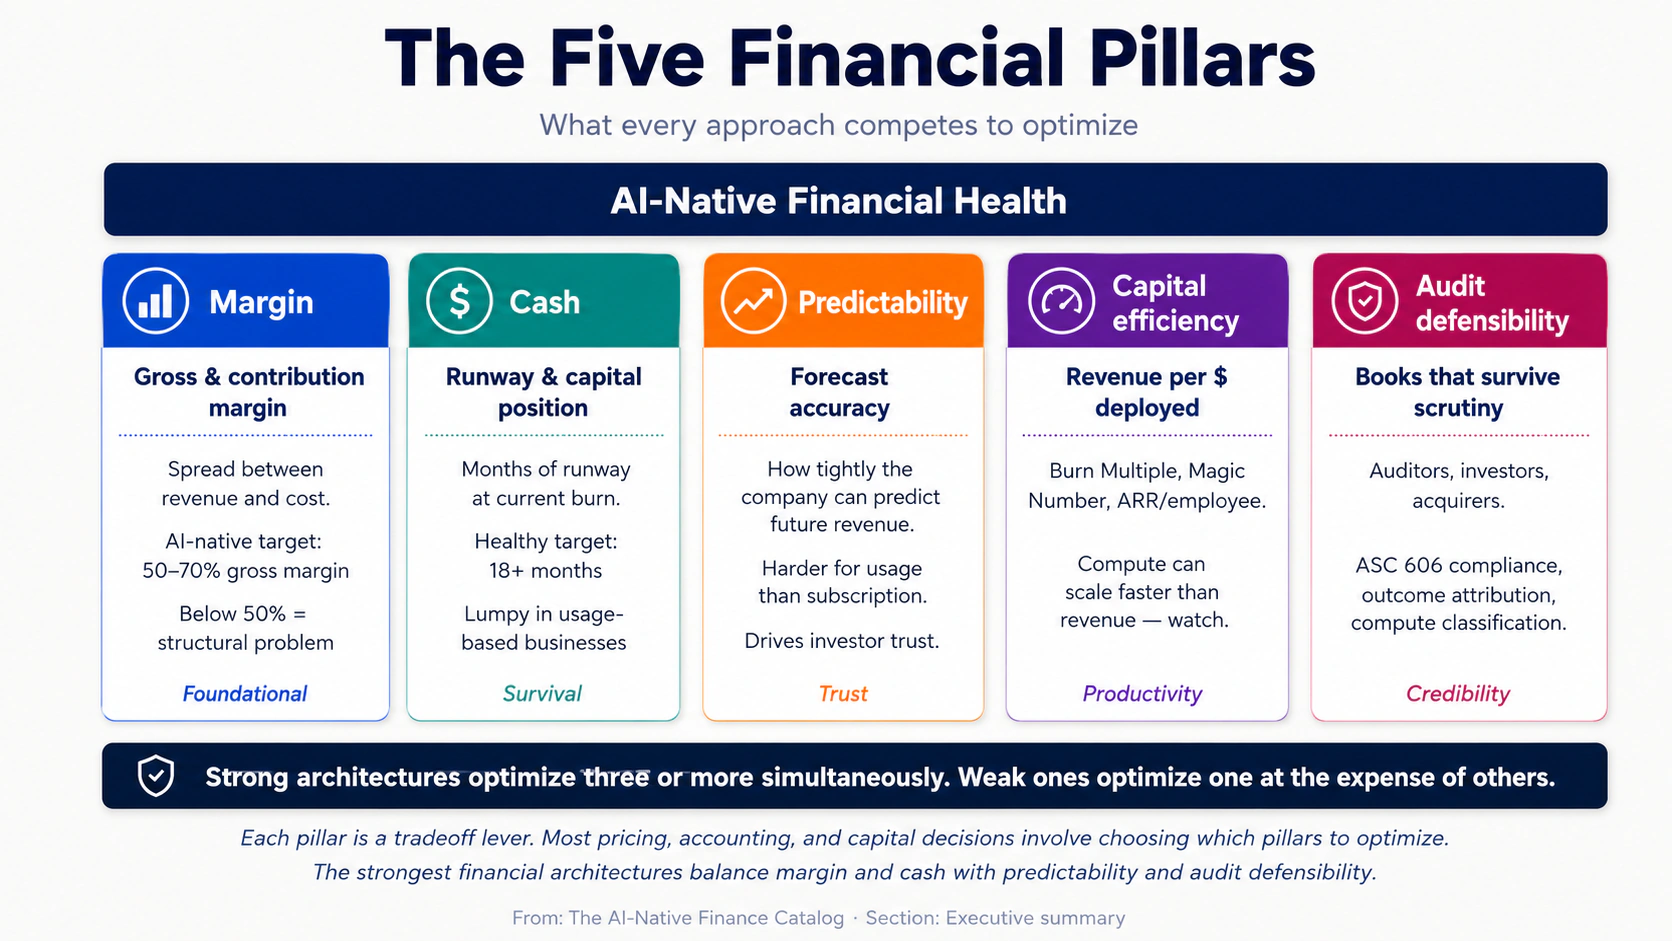
The five financial pillars — what every approach competes to optimize.
Margin is the spread between revenue and cost. Gross margin (revenue minus compute and direct costs) is the metric that determines whether the business model works at all. AI-native companies that ship with gross margin below 50% rarely recover; companies above 70% have meaningful pricing power.
Cash is the runway-determining metric — how much capital the company has and how long it lasts at current burn rate. AI-native companies often have lumpy cash flows because of usage-based revenue (which can spike or contract with customer activity) and prepaid compute commitments to foundation-model providers.
Predictability is the accuracy of the forecast. Traditional SaaS achieves high forecast accuracy because subscription revenue is predictable; AI-native businesses face structural forecast uncertainty because of usage variance, model-price decay, and outcome-attribution complexity.
Capital efficiency is revenue produced per dollar of capital deployed. The "Burn Multiple" metric (capital burned divided by net new ARR) and the "Magic Number" (sales efficiency) are common shorthand. AI-native companies face a particular efficiency challenge because compute spend can scale faster than revenue.
Audit defensibility is the books' ability to survive scrutiny — from auditors during a year-end audit, from investors during due diligence, and from acquirers during M&A. AI-native companies face new audit-defensibility challenges around outcome attribution, usage-based revenue recognition, and the capitalization-versus-expense treatment of model fine-tuning costs.
The strongest financial architectures optimize three or more of these pillars simultaneously. The weakest optimize one (typically margin or cash) at the expense of the others — which produces a short-term win and a long-term collapse.
A note on scope. This catalog focuses primarily on B2B AI-native companies at any stage from seed through Series C. Consumer AI companies (apps with millions of free users monetized through tiered subscriptions or ads) follow different rules and are not the primary subject here, though several approaches — Per-Seat Pricing, Per-Call Pricing, Hybrid Pricing — apply to both contexts. Late-stage public-company finance (IPO readiness, public-company reporting, segment disclosures) is also out of scope.
The maturity spectrum. Each approach is tagged Proven, Emerging, or Speculative based on how widely AI-native companies are running it successfully today.
- Proven approaches have many at-scale companies operating on them, with established playbooks and benchmarks.
- Emerging approaches are being run by AI-native companies in 2026 but are evolving rapidly with the underlying tooling and accounting standards.
- Speculative approaches depend on practices or buyer behaviors that do not yet exist at scale.
What this page is for
This document serves three purposes.
First, as a chooser. A founder or finance leader designing an AI company's financial architecture can use the Strategic Fit Matrix, the Finance Diagnostic, and the Approach Summary Table to find the architectures that fit their stage, buyer, and contract structure.
Second, as a reference. A finance team running an existing architecture can use the deep sections to audit their own operation against the documented mechanics — comparing their gross margin, cohort behavior, and forecast accuracy against the patterns described.
Third, as a sequencing guide. Most successful AI-native companies evolve their financial architecture as they scale. The Common Hybrid Models section maps the most common evolution paths.
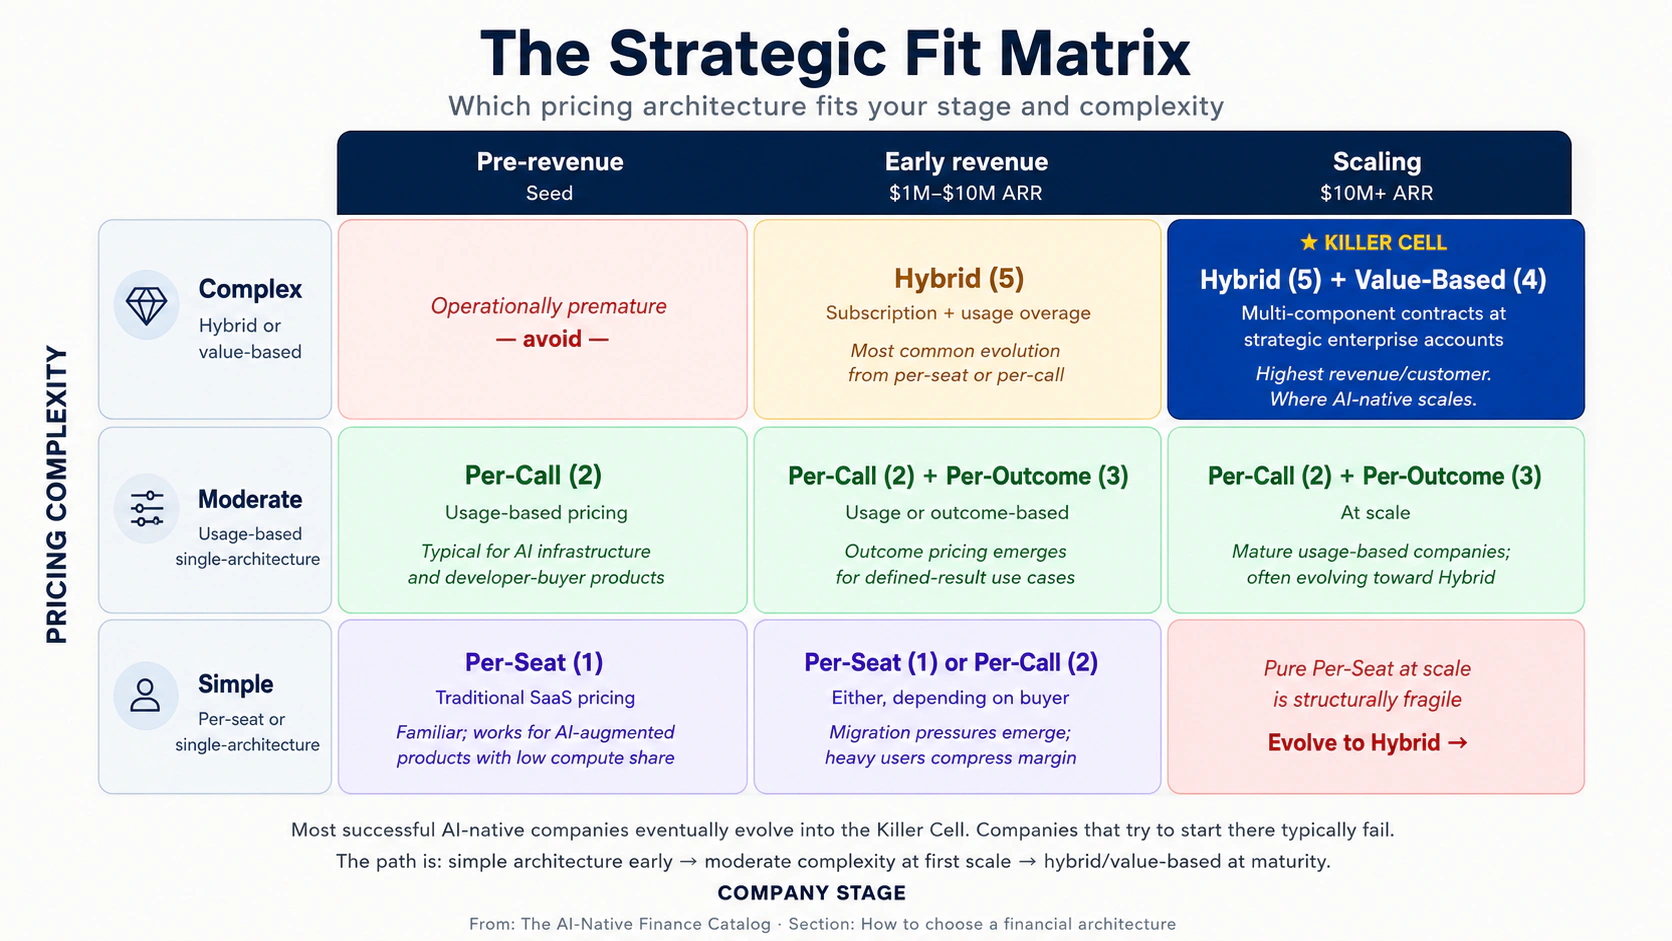
How to choose a financial architecture
The cleanest predictor of which financial architecture fits is the intersection of pricing complexity and company stage. The matrix below maps the twelve approaches onto those two axes.
| Stage → / Pricing complexity ↓ | Pre-revenue (Seed) | Early revenue ($1M–$10M ARR) | Scaling ($10M+ ARR) |
|---|---|---|---|
| Simple (per-seat or single-architecture) | Per-Seat (1) | Per-Seat (1), Per-Call (2) | — |
| Moderate (usage-based, single-architecture) | Per-Call (2) | Per-Call (2), Per-Outcome (3) | Per-Call (2), Per-Outcome (3) |
| Complex (hybrid or value-based) | — | Hybrid (5) | Hybrid (5), Value-Based (4) |
The cell that matters most is complex × scaling — Hybrid Pricing and Value-Based Pricing. These are the architectures that produce the highest revenue per customer and the most defensible pricing power, but they require sophisticated finance, sales, and customer-success operations to execute. Most successful AI-native companies eventually evolve into this cell; companies that try to start there typically fail because the operational maturity is not yet present.
Finance diagnostic: eight questions
Before picking a financial architecture, score yourself honestly on the eight dimensions below. The approaches each row points to are the ones most aligned with that condition.
-
Buyer type. Developer / API consumer → Per-Call (2). Operator buying SaaS → Per-Seat (1) or Hybrid (5). Enterprise buyer with budget for outcomes → Per-Outcome (3) or Value-Based (4).
-
Average deal size. <$10K/year → Per-Seat or Per-Call. $10K–$100K → Per-Call or Hybrid. $100K+ → Per-Outcome, Value-Based, or Hybrid.
-
Cost structure variability. Compute cost is small and stable → Per-Seat works fine. Compute cost varies significantly with usage → Per-Call required. Compute cost is significant but the value-per-outcome is much higher → Per-Outcome possible.
-
Sales motion. Self-serve PLG → Per-Call or Per-Seat. Vendor-led mid-market → Per-Seat, Per-Call, or Hybrid. Enterprise field → Per-Outcome, Value-Based, or Hybrid (see Sales Catalog Motions 7–10).
-
Customer technical sophistication. High (developers, technical operators) → Per-Call works; users tolerate variable bills. Low (executive buyers, ops) → Per-Seat or Hybrid; users want predictable bills.
-
Contract length. Monthly self-serve → Per-Call or Per-Seat. Annual SaaS → Any architecture. Multi-year enterprise → Hybrid or Value-Based.
-
Forecast accuracy required. Tight (board-driven targets, public-company-style discipline) → Per-Seat or Hybrid (more predictable). Loose (early-stage, growth at all costs) → Per-Call or Per-Outcome.
-
Internal finance maturity. Founder doing books in spreadsheet → Per-Seat or Per-Call (simplest accounting). Controller in place → Per-Outcome possible. Full finance team → Value-Based and complex Hybrid feasible.
The diagnostic does not tell you which architecture is correct. It tells you which architectures are available given your starting position. The matrix above and the deep sections below tell you which available architecture fits the buyer you are pricing for.
Approach summary table
A one-page reference for all twelve approaches.
| # | Approach | Maturity | Best for | Main strength | Main risk |
|---|---|---|---|---|---|
| 1 | Per-Seat Pricing | Proven | Predictable-usage SaaS | Forecast simplicity | Disconnects price from cost |
| 2 | Per-Call / Usage Pricing | Proven | Developer-buyer infrastructure | Aligns price with cost | Customer bill anxiety |
| 3 | Per-Outcome Pricing | Emerging | Defined-result use cases | Maximum value capture | Outcome-attribution complexity |
| 4 | Value-Based Pricing | Emerging | Strategic enterprise deals | Premium pricing | Contracting maturity required |
| 5 | Hybrid Pricing | Proven | Mid-market and enterprise scale | Balance of predictability and capture | Complexity to communicate |
| 6 | Revenue Recognition | Proven | Any company with revenue | Audit defensibility | ASC 606 complexity for usage/outcome |
| 7 | Compute COGS Accounting | Proven | Any AI-native company | Margin clarity | Misclassification risk |
| 8 | Cohort Analysis with Model-Cost Decay | Emerging | Companies $5M+ ARR | Truth about unit economics | Requires data discipline |
| 9 | Pilot Economics & Contract Mechanics | Proven | Enterprise sales motions | Pilot-to-production conversion | Premature production accounting |
| 10 | Forecasting Under Falling Compute Costs | Emerging | Companies on usage models | Realistic margin trajectory | Over-optimism on compute decay |
| 11 | Capital Allocation | Proven | Any post-Series A | Strategic spend discipline | Compute over-investment |
| 12 | Investor & Board Reporting | Proven | Any post-Series A | Stakeholder alignment | Vanity metrics over substance |
Which approach should I run?
A decision flowchart sequences the most important questions for narrowing your architecture choice.
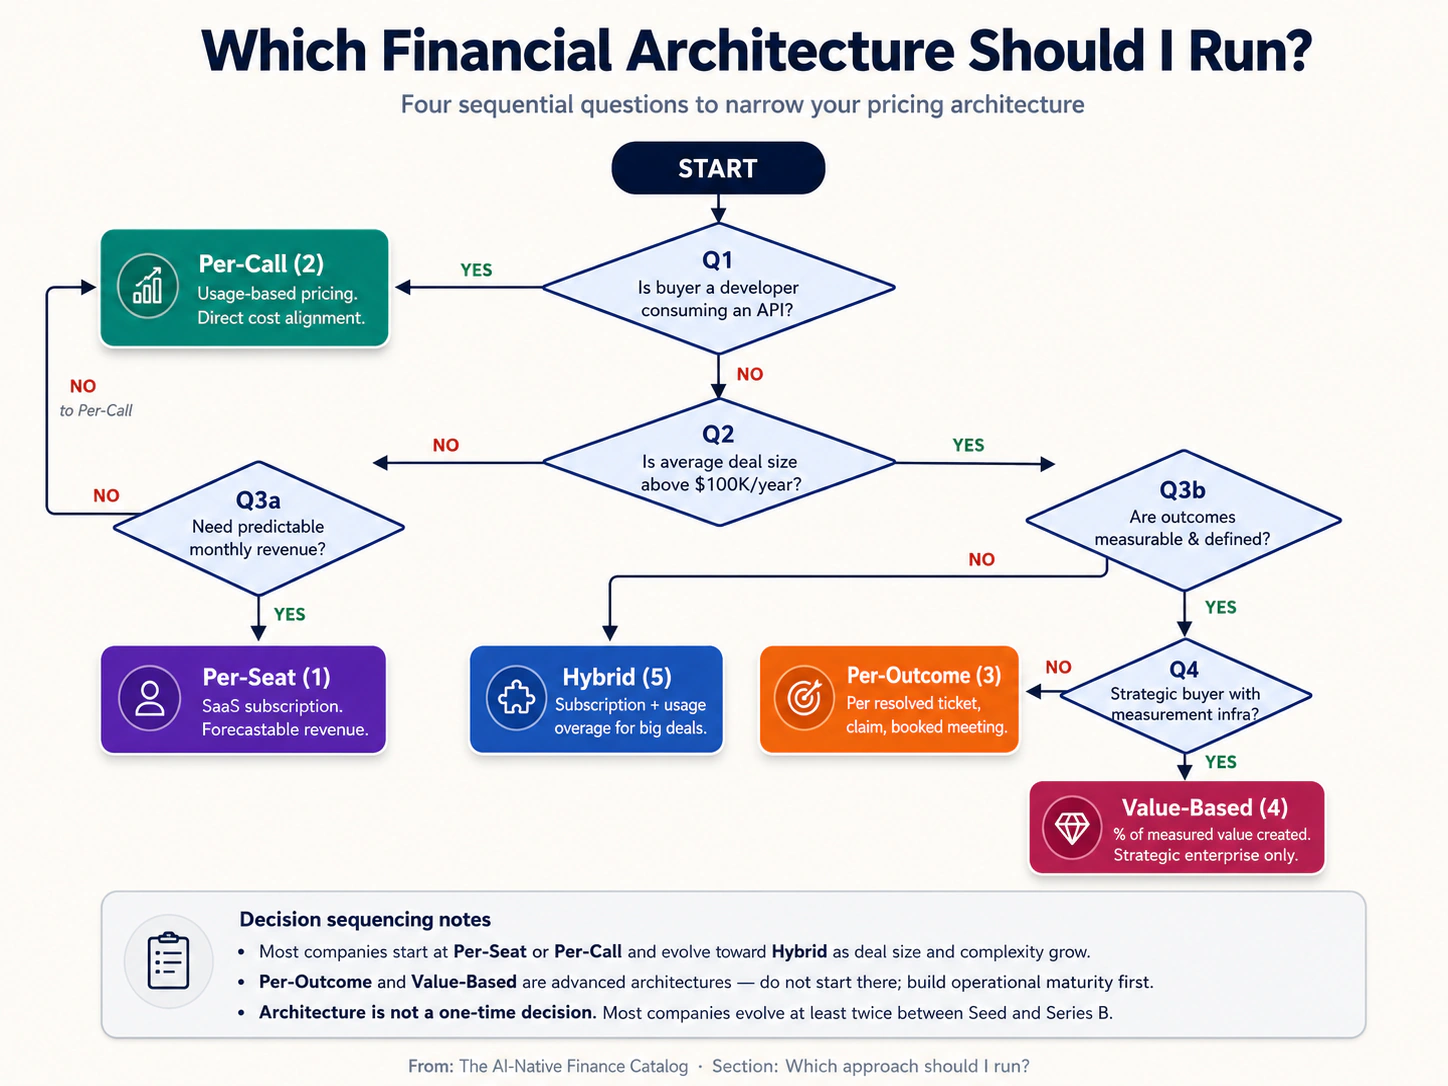
The four key questions are: (1) Is your buyer a developer using your API? (yes → Per-Call). (2) Is your average deal size above $100K? (yes → consider Per-Outcome, Value-Based, or Hybrid). (3) Do you need predictable revenue for forecasting? (yes → Per-Seat or Hybrid; no → Per-Call or Per-Outcome). (4) What is your finance team's operational maturity? (low → simpler architectures; high → complex architectures feasible).
The financial maturity curve
Every AI-native company moves through three stages of financial maturity. The architecture and operational practices that fit each stage are different — and trying to run a stage-3 architecture at stage 1 is one of the most common ways founders waste money.
Three stages define the Financial Maturity Curve:
Stage 1 — Pre-revenue (Seed-stage). The company has product but limited revenue. Finance work is minimal: track burn, manage runway, file basic taxes, prepare for the first audit-equivalent (typically a Quality of Earnings review during Series A diligence). The right architecture is whichever pricing model is simplest to implement and easiest to explain to early customers — usually Per-Seat (1) or Per-Call (2). Finance team: founder, supplemented by Pilot/Bench/Puzzle for bookkeeping.
Stage 2 — Early revenue ($1M–$10M ARR). The company has product-market fit signals and meaningful customer count. Finance work expands to include monthly close, board reporting, basic forecasting, and the first internal cohort analyses. Pricing architectures stabilize, but the team begins seeing pressure to evolve — enterprise customers want different terms, customer-success metrics demand outcome thinking, investors expect cleaner unit economics. The right architecture is whichever pricing model produces clear cohort retention with manageable accounting complexity. Finance team: controller (full-time or fractional), bookkeeper, founder still involved in major decisions.
Stage 3 — Scaling ($10M+ ARR). The company is preparing for or has completed a Series B. Finance work includes full FP&A, audit preparation, complex contract accounting, and increasingly sophisticated investor and board reporting. Hybrid Pricing (5) and Value-Based Pricing (4) become operationally feasible. Cohort analysis with model-cost decay (Approach 8) becomes a board-level metric. Capital allocation (Approach 11) becomes the central strategic question. Finance team: VP Finance or CFO, controller, FP&A analyst(s), and increasingly specialized roles (revenue operations, treasury).
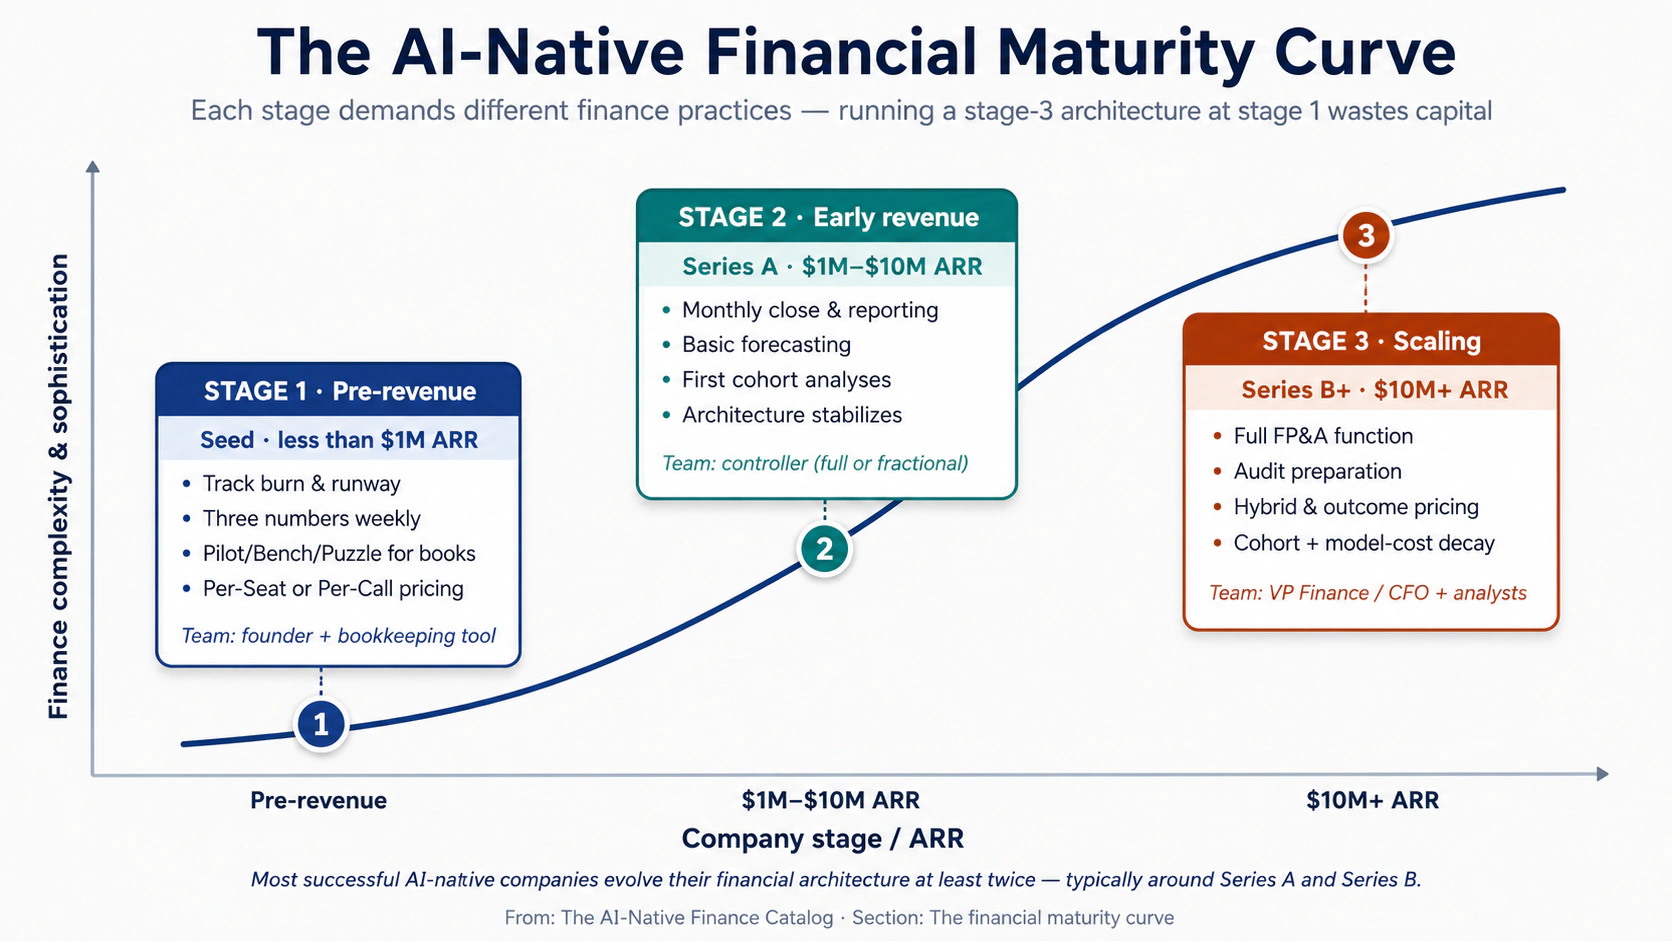
The implication for founders is that financial architecture is not a one-time decision. The right architecture for your stage today will probably need to evolve at least twice before the company reaches scale — typically once around the Series A (introducing more sophisticated cohort discipline) and once around the Series B (introducing hybrid pricing or outcome-based components). Companies that lock in their stage-1 architecture and try to scale without evolution typically hit a ceiling in the high-single-digit-millions of ARR.
Maturity legend
- Proven. The approach has many AI-native (and pre-AI) companies operating it at scale today, with established playbooks and benchmarks.
- Emerging. The approach is being run by AI-native companies in 2026 but is evolving rapidly — the canonical playbook has not yet stabilized.
- Speculative. The approach depends on practices or buyer behaviors that do not yet exist at scale.
A. Pricing architectures
The way the company charges customers. Pricing architecture is the single most consequential financial decision an AI-native company makes — it cascades through revenue recognition, sales-team compensation, customer-success focus, forecast complexity, and gross-margin structure. Most companies start with one architecture and evolve toward hybrid as they scale.
Approach 1 — Per-Seat Pricing
Maturity: Proven. Beginner difficulty: Easy.
In Plain English. Per-Seat Pricing is the SaaS model everyone learned in the 2010s: customer pays a fixed fee per user, per month. Ten users at $50/month each is $500/month. The customer's bill is predictable, the company's revenue is predictable, and accounting is straightforward. The only question is how many seats the customer needs.
For AI products, this model is increasingly awkward. AI compute costs scale with usage, not seat count. A customer with ten seats might generate ten thousand AI calls or ten million; the cost of serving them differs by orders of magnitude, but the revenue is identical. Companies that ship Per-Seat Pricing for genuinely AI-heavy products often find themselves with negative gross margin on their heaviest users.
Best as a starting architecture for AI-augmented SaaS where AI is one feature among many. Increasingly inappropriate for products where AI is the core value driver.
Core idea. Charge a predictable fee per user, accepting that revenue will not track usage and that heavy users may produce negative unit economics.
When to use it. When the product is AI-augmented but not AI-defined — AI is a feature inside a broader workflow product. When the buyer is an executive who needs predictable line-item budgeting. When the underlying compute cost per seat is small enough (under 10–15% of subscription revenue) that usage variability does not threaten gross margin.
Mechanism. Per-Seat Pricing works because it gives both the buyer and seller predictability. The buyer can budget; the seller can forecast. Annual contracts produce contracted ARR (annual recurring revenue), which is the metric Wall Street has trained AI companies to optimize for over the last decade.
The structural problem for AI products is the disconnection between price and cost. Foundation-model API pricing is unit-based: per token, per second of audio, per image generation. When the product wraps that API behind a per-seat subscription, every call the user makes is a cost the seller absorbs. Heavy users — typically the customer's most engaged employees, ironically — produce the most usage and therefore the most cost. If the average compute cost across all users is 20% of seat revenue, the heaviest decile may produce compute costs of 80% or more of their seat revenue, leaving thin margin or even negative contribution.
The fix in 2026 is rarely to abandon Per-Seat Pricing entirely; it is to add a usage-based component to the contract — a per-call or per-token overage above an included quota. This converts pure Per-Seat into Hybrid Pricing (Approach 5), which is the most common architecture in AI-native SaaS at scale.
Fictional walk-through. Imagine MeetingMind, an AI meeting-summary tool sold at $30/seat/month. A customer with 100 seats pays $36,000/year. Of those 100 users, 20 use the product heavily (50+ summaries per month each), 60 use it lightly (5–10 summaries), and 20 are inactive. The 20 heavy users generate compute costs of $25/month each ($6,000/year total); the rest generate trivial costs. Total compute is roughly $7,000/year against $36,000 revenue — gross margin around 80%, comfortable. Now imagine the heavy-user share rises to 50% as the product gets stickier. Compute costs rise to $15,000+; gross margin drops to 60%. The seller has to either introduce overage pricing or watch margin erode.
Example. Confirmed pattern: Most AI-augmented productivity tools (Notion AI, Linear with AI, Asana Intelligence) ship Per-Seat Pricing for their core SaaS, often with usage-tier limits to cap compute exposure. Pure Per-Seat without limits is rarely seen in heavy-AI products by 2026.
Primary risk. Negative unit economics on heavy users. The most engaged users are also the most expensive to serve, but they pay the same price as light users. Mitigation: monitor compute-per-seat by user cohort, introduce usage caps or overage pricing once the heavy-user share exceeds a threshold, and consider Hybrid Pricing (Approach 5) as the natural evolution.
First move. Calculate average compute cost per seat across your current customer base. If it exceeds 15% of seat revenue, begin planning the transition to Hybrid Pricing.
Approach 2 — Per-Call / Usage Pricing
Maturity: Proven. Beginner difficulty: Easy.
In Plain English. Per-Call Pricing is the AI infrastructure standard. Customers pay per API call, per token consumed, per second of audio processed, per image generated, or per query executed. Revenue scales with usage; costs scale with usage; the alignment is direct. OpenAI, Anthropic, ElevenLabs, Replicate, and most AI infrastructure companies use this model.
The advantage is that gross margin is structurally preserved — every call's revenue is set above its compute cost, so the company never loses money on a unit basis regardless of customer behavior. The disadvantage is that customer bills are unpredictable, which produces a recurring problem in customer success and renewal: every spike in usage produces a spike in bill, and customers who exceed their internal budget become unhappy customers.
Best as the founding architecture for AI infrastructure products and developer-buyer products. Common as one component of Hybrid Pricing in operator-buyer products.
Core idea. Align price directly with usage and cost. Each call costs the company some amount in compute; charge above that amount with a margin built in.
When to use it. When the buyer is a developer or technical user comfortable with usage-based billing. When the product is genuinely usage-variable — different customers consume dramatically different amounts. When the team is willing to invest in usage instrumentation, billing infrastructure, and the customer-success work of helping buyers manage their bills.
Mechanism. Per-Call Pricing works because it solves the gross-margin problem at the architecture level. Every call is priced above its cost, so margin is mathematically protected. Forecasting is harder than Per-Seat (revenue depends on usage, which depends on customer behavior, which is variable), but for many AI infrastructure products the forecasting penalty is acceptable in exchange for margin safety.
The execution requires three operational disciplines that traditional SaaS does not need. Usage instrumentation — every billable event must be measured, attributed to the right customer, and stored in an auditable record. Billing infrastructure — generating accurate, defensible invoices monthly is harder than fixed-fee billing; mistakes are visible to customers immediately. Customer-success around bill management — customers need dashboards to monitor their usage, alerts when usage spikes, and the ability to set caps or budgets to avoid surprise bills. Companies that ship usage-based pricing without these three disciplines see customer churn driven by bill anxiety, not by product dissatisfaction.
The constraint at scale is bill-shock. A customer who used $5K in compute in January and $50K in February sees a 10x bill increase that requires internal approval to pay. The default response — "we'll review next year" — translates to lost revenue. Mature usage-based companies invest heavily in bill-prediction tools, capacity-planning conversations, and proactive outreach when usage trajectories suggest budget concerns.
Fictional walk-through. Imagine TextAI, an LLM API company. Customers pay $0.005 per 1K input tokens and $0.015 per 1K output tokens. A typical customer signs up, builds an integration, runs experiments costing $200/month for the first three months, then deploys to production and ramps to $5,000/month over the next six months. By month nine, they are processing 50M tokens daily and paying $150K/month. The customer's bills are unpredictable; their CFO complains every month; the customer-success team spends 30% of its time helping them forecast. But TextAI's gross margin on the customer is steady at 65% across every month — the architecture protects the business model regardless of how the customer ramps.
Example. Confirmed examples: OpenAI, Anthropic, Cohere, Mistral, ElevenLabs, Replicate, Together AI, Fireworks AI, and the long tail of AI infrastructure companies. Almost every AI-API business in 2026 uses some form of usage pricing.
Primary risk. Bill-shock and customer churn. Customers who exceed budget become unhappy customers regardless of how good the product is. Mitigation: invest in usage dashboards, budget alerts, monthly capacity-planning conversations with major customers, and the option for customers to set hard caps on spend (accepting that hitting the cap produces a different kind of pain — service interruption — that needs to be managed carefully).
Secondary risk. Forecast unpredictability. Usage-based revenue is harder to forecast than subscription revenue, which complicates fundraising, board reporting, and operational planning. Mitigation: build cohort-based forecast models that project usage growth from prior customer behavior; invest in lead indicators (calls per active user, active-user growth rate) that are more predictable than total usage.
First move. If your product is genuinely usage-variable and your buyer is technical, ship Per-Call Pricing from the start. Set a price per unit of consumption that gives you 60%+ gross margin [Emerging pattern: the AI-native floor below which scaling becomes structurally difficult], instrument usage carefully, and build a usage dashboard before you have your first customer.
Approach 3 — Per-Outcome Pricing
Maturity: Emerging. Beginner difficulty: Medium.
In Plain English. Per-Outcome Pricing means the customer pays only when the AI delivers a defined result. A resolved support ticket, a processed insurance claim, a booked sales meeting, a successfully completed agent task. The customer is not paying for access, time, or compute — they are paying for outcomes. If the AI fails to deliver, the customer does not pay.
This pricing model — sometimes called "Service-as-Software" — is the most distinctive innovation in AI commercial structure in the last few years. It is operationally complex, accounting-heavy, and dependent on the company's ability to attribute outcomes accurately. But for use cases where outcomes are measurable, it produces dramatically higher per-customer revenue than Per-Call or Per-Seat alternatives, because the price is anchored to the customer's labor budget rather than their software budget.
Best for use cases with clearly defined, measurable outcomes that the AI can reliably deliver. Almost always combined with Sales Catalog Motion 9 (Pay-Per-Outcome). Operationally complex; requires substantial outcome-attribution infrastructure.
Core idea. Charge per delivered outcome, anchoring price to the customer's labor cost rather than the seller's software cost.
When to use it. When the use case has a clear, measurable, attributable outcome. When the customer's alternative is hiring humans to do the same work (so the comparison anchor is human labor cost). When the company is willing to invest in outcome-attribution infrastructure — typically the largest single non-product engineering investment in the early years of running this architecture.
Mechanism. Per-Outcome Pricing works because it lets the seller capture a fraction of the customer's labor budget rather than a fraction of their software budget. A mid-market company spends ten times more on customer-support headcount than on customer-support software. The AI vendor that captures a fraction of the headcount budget through outcome pricing operates in a different revenue category than the vendor capturing a fraction of the software budget.
The pricing math anchors to human labor cost. If a customer-support representative costs roughly $5 per resolved ticket all-in (salary, benefits, management overhead, workspace), the outcome price ceiling sits around $1–3 per resolved ticket — enough below human cost that the customer captures real savings, enough above the seller's compute cost that gross margin is positive. The seller's compute cost per outcome (typically $0.20–0.80 for a well-optimized agent [Author thesis: based on observed deployments in 2026; sensitive to model choice and prompt efficiency]) sets the floor; the customer's human cost sets the ceiling; price lives somewhere in between.
The technical foundation is outcome attribution. The vendor must produce audit-grade telemetry — for every priced outcome, a verifiable record of what the AI did, what it processed, and how the result was confirmed. Without this, customer disputes have no objective basis and revenue collection becomes a quarterly negotiation. Companies running this architecture well treat outcome-attribution infrastructure as part of the product, not as accounting overhead, and staff it with engineers, not finance analysts.
The accounting complexity is real. Revenue is recognized as outcomes are delivered (not when the contract is signed), which means the contract-to-revenue conversion is not 1:1 — the company books bookings of $1M but recognizes revenue only as outcomes accrue, potentially over many months. Combined with the standard ASC 606 requirements (Approach 6), this produces a deferred-revenue mechanic that traditional SaaS finance has not had to manage.
Fictional walk-through. Imagine TicketBot, an AI customer-support agent. TicketBot does not charge customers per seat or per call. Instead, the customer pays $0.50 for every support ticket TicketBot resolves on its own (without escalating to a human). A customer with 50,000 tickets per month gets a $25,000 monthly bill — but only if TicketBot actually resolves the tickets. If TicketBot resolves only 30% of incoming tickets, the bill is $7,500. The customer's CFO loves the model; the customer's procurement team needs to learn how to structure the contract; TicketBot's own finance team has to invest in outcome-attribution infrastructure to defend each billable event.
Example. Confirmed examples: Sierra's per-resolution pricing for AI customer service. Decagon's outcome-based contracts. EvenUp's per-claim pricing for personal-injury legal work. The pattern is among the most actively-expanding pricing structures in 2026, and almost universally appears in companies that also run Sales Catalog Motion 9.
Primary risk. Outcome-attribution disputes. Without audit-grade telemetry, customer disputes about what counts as a "resolved" outcome turn collection into negotiation. Mitigation: invest in attribution infrastructure as a core engineering function. Build the telemetry before the first contract; do not retrofit it later.
Secondary risk. Revenue recognition complexity. Outcome contracts under ASC 606 require careful structuring and may produce surprising deferred-revenue patterns. Mitigation: work with an AI-experienced revenue accountant from the first contract; do not assume traditional SaaS revenue recognition rules apply.
First move. Define one outcome that is unambiguous, measurable, and attributable. Price the first contract conservatively (closer to your cost floor than your value ceiling) to learn the operational mechanics. Scale price upward only after you have lived with attribution disputes for at least six months.
Approach 4 — Value-Based Pricing
Maturity: Emerging. Beginner difficulty: Advanced.
In Plain English. Value-Based Pricing means the customer pays a percentage of the measured business value the AI creates for them. A hedge fund deploys an AI tool that improves trading efficiency by $40M per year; the AI vendor's contract is structured at 15% of measurable improvement, paying $6M/year. The price is anchored not to the seller's cost or to comparable software, but to the customer's measured outcomes.
This is the highest-revenue-per-customer pricing model in AI, and the rarest. It requires sophisticated contracting, executive sponsorship at the buyer (typically C-suite), and substantial investment in measurement infrastructure to defend the value calculation. By 2026, it appears mostly in strategic enterprise deployments at financial services, large healthcare systems, and consulting firms — buyers with both the analytical sophistication to measure value rigorously and the procurement flexibility to structure non-standard contracts.
Best for strategic enterprise deals where measured value is large enough to support the operational overhead. Always combined with Sales Catalog Motion 10 (Value-Based Engagement).
Core idea. Charge a percentage of measured customer value created, removing the conventional vendor-buyer adversarial dynamic where the vendor wants to charge for access and the buyer wants to pay for results.
When to use it. When the customer is a sophisticated enterprise with both the data infrastructure to measure value and the procurement flexibility to structure non-standard contracts. When the deployment will produce measurable, attributable outcomes large enough to support the operational overhead (typically $5M+ in annual measured value). When the executive sponsor at the buyer has authority to override standard procurement.
Mechanism. Value-Based Pricing works when both parties can agree on what value means and how to measure it. The contract structure is materially more complex than seat-, usage-, or outcome-based pricing. A typical agreement has four components. A baseline measurement period (typically 30–90 days before deployment) establishes what the customer's metrics looked like without the AI. A value-share formula defines what fraction of the measured gain the vendor captures — typically 5–25%, varying by deal complexity and buyer sophistication. A ceiling and floor caps both upside (so the vendor does not earn more than the customer's executives can defend internally) and downside (so the vendor is not paying the customer to deploy the product). And audit rights give the vendor the ability to verify the customer's reporting on the metrics that drive billing — without audit rights, customer procurement will under-report measured value at the first true-up cycle.
The operational constraint is contracting maturity. Most enterprise procurement organizations are not yet equipped to structure value-based deals at scale; legal, finance, and operations all need representatives who understand the model and have authority to commit to non-standard contract terms. This is why these deals typically require an executive sponsor at the C-suite level — only that authority can override the procurement organization's default of "we don't structure deals this way." Without the sponsor, the proposal stalls in mid-organization indefinitely.
The financial accounting complexity is substantial. Revenue recognition under ASC 606 for value-based contracts is non-trivial — the variable consideration is constrained to the amount the company can support with reasonable reliability, which often means revenue is recognized at much less than the contract's nominal upside until a track record is established. Auditors examining these contracts in year one are typically conservative; year-three auditors with multiple periods of comparable data are typically more permissive.
Fictional walk-through. Imagine CashFlow, an AI tool for hedge funds. A $50B fund deploys CashFlow and, over a 12-month measurement period, attributes a $40M annual improvement in trading efficiency to the deployment. CashFlow's contract is structured at 15% of measurable improvement above baseline: the fund pays $6M annually for the duration of the contract. The deal took nine months to negotiate, required the fund's CIO and CFO to personally approve, and only made it through procurement because the executive sponsor pushed it through. CashFlow's accounting team spent the first year recognizing revenue conservatively at $2M while the audit-defensible track record was being built; in year two, after the value calculation has been confirmed by multiple measurement cycles, full $6M revenue recognition becomes defensible.
Example. Emerging analogues: Some Anthropic Applied AI engagements with strategic enterprise customers. Some Palantir deployments structured around mission outcomes. Forward-leaning AI deployments at financial services, healthcare, and large consulting firms. The pattern is too young to have a canonical exemplar, but the contract templates are increasingly available through Big Four consulting practices.
Primary risk. Contracting collapse. The deal stalls in mid-organization for months because procurement has no template for the contract structure. Mitigation: identify and recruit the executive sponsor before drafting the contract. The sponsor's authority is the unblocking mechanism; without it, the deal will not close regardless of merit.
Secondary risk. Audit conservatism. Year-one revenue recognition under ASC 606 may be substantially below the contract's nominal value, producing a surprising P&L that confuses investors. Mitigation: engage an AI-experienced revenue accountant before signing the first value-based contract; structure investor reporting around bookings as well as recognized revenue.
First move. Do not pursue Value-Based Pricing as a first architecture. Build operational maturity through Per-Call (2), Per-Outcome (3), or Hybrid (5) first. Only attempt Value-Based once the company has a controller, an experienced contracts attorney, and an executive sponsor inside a target buyer.
Approach 5 — Hybrid Pricing
Maturity: Proven. Beginner difficulty: Medium.
In Plain English. Hybrid Pricing combines two or more of the architectures above into a single contract. The most common pattern is a base subscription (Per-Seat or platform fee) plus usage overages above an included quota — the customer gets predictable budgeting for normal usage and pays incrementally for heavy usage. Other hybrids combine subscriptions with outcome-based bonuses, or platform fees with per-call infrastructure charges.
By 2026, Hybrid Pricing is the dominant architecture for AI-native companies at scale.⁵ Pure single-architecture pricing is increasingly limited to early-stage companies that have not yet evolved their model. The reason hybrids dominate is that they balance the structural strengths of multiple architectures — the predictability of subscription, the cost-alignment of usage, and (for some hybrids) the value capture of outcome.
Best as the natural evolution from Per-Seat or Per-Call once the company reaches mid-market and enterprise scale. Adds operational complexity; requires careful contract design and customer-success investment in helping buyers understand the structure.
Core idea. Combine architectures to balance predictability, cost-alignment, and value capture in a way no single architecture can achieve alone.
When to use it. When customer revenue has reached a scale where pure per-seat or per-call breaks down (heavy users producing margin compression, light users producing churn risk, or enterprise buyers demanding more sophisticated contracts). When the team has the contracting and operational maturity to design and execute multi-component pricing.
Mechanism. The most common Hybrid Pricing structure in AI-native SaaS is "Per-Seat plus Usage Overage": customers pay a fixed fee per seat per month, with an included quota of AI calls per seat per month and per-call charges for usage above the quota. This structure preserves the budgeting predictability buyers love about Per-Seat while protecting the seller's gross margin against heavy users. Variants include "Platform Fee plus Usage" (a fixed fee for the right to use the API plus per-call charges), "Subscription plus Outcome Bonus" (a base subscription plus per-outcome charges for advanced agents), and "Tiered Subscription" (multiple subscription tiers, each with different included quotas and per-call rates).
The execution requires three disciplines. Contract design — multi-component pricing requires careful legal and pricing-strategy work to avoid customer confusion or unintentional margin leakage. Usage instrumentation — even hybrid contracts need clean usage tracking, both for billing the overage component and for forecasting customer behavior. Customer education — buyers in operator and executive roles often struggle to forecast hybrid bills; the customer-success team has to invest meaningful time in helping customers understand their projected costs.
The financial accounting complexity sits at the intersection of subscription and usage accounting. Revenue from the subscription component is recognized ratably over the contract term; revenue from the usage component is recognized as usage occurs. ASC 606 treats these as separate performance obligations, which means the contract must allocate the transaction price across components based on relative standalone selling prices — a non-trivial exercise that often requires explicit guidance from a revenue accountant.
The constraint at scale is communication complexity. Customers who cannot easily forecast their bills become anxious customers; anxious customers churn. Mature hybrid-pricing companies invest in dashboards, projection tools, and contract structures that maximize predictability — for example, monthly true-up windows rather than continuous metering, or quarterly commitments with overage review at the end of the quarter rather than at the end of every month.
Fictional walk-through. Imagine AgentPlatform, an AI agent infrastructure company. The pricing is hybrid: customers pay $5,000/month for the platform (including 1M agent calls per month) plus $0.005 per call above the quota, with annual contracts and quarterly true-up. A typical customer signs a $60K base annual contract and ramps usage from 200K calls/month at signup to 5M calls/month by month twelve. By the end of year one, the customer's actual revenue contribution is $60K (subscription) plus $180K (overage on 36M extra calls × $0.005) = $240K annual revenue, four times the base contract. The customer's bills are predictable enough to forecast (they get quarterly true-up notices); AgentPlatform's gross margin stays clean because heavy usage is priced above its compute cost.
Example. Confirmed examples: GitHub Copilot's Business and Enterprise tiers (subscription with usage components), Cursor's enterprise plans (subscription plus token overages), most enterprise AI vendors with mature pricing (Glean, Harvey, Sierra at large accounts). Hybrid Pricing is the dominant architecture among $10M+ ARR AI-native companies in 2026.
Primary risk. Contract complexity confusing customers. Buyers who cannot easily forecast their bills churn at higher rates than buyers on simpler pricing. Mitigation: invest in projection dashboards, quarterly true-up windows rather than monthly, and customer-success conversations that walk new customers through their projected costs.
Secondary risk. Revenue recognition complexity. ASC 606 treatment of hybrid contracts is more complex than pure subscription or pure usage; mistakes in standalone-selling-price allocation can produce material restatements. Mitigation: engage a revenue accountant familiar with multi-component AI contracts before designing the pricing structure; do not rely on standard SaaS revenue-recognition templates.
First move. If you have a Per-Seat product hitting margin compression on heavy users, or a Per-Call product producing customer-success burden on bill anxiety, design a hybrid that adds the missing component (usage overage or subscription floor). The simplest first hybrid is "current pricing plus a single overage component"; do not try to design a six-component contract on day one.
B. Revenue & cost mechanics
The technical work of finance — turning customer activity into auditable books, classifying compute costs correctly, and maintaining the cohort discipline that surfaces unit-economics truth. These approaches are less visible than pricing but more consequential to long-term financial health. A company can survive imperfect pricing for years; it cannot survive imperfect revenue recognition or COGS misclassification past the first audit.
⚠ A note on accounting and tax advice. This section discusses revenue recognition (ASC 606), COGS classification, capitalization of training costs, deferred revenue, and audit defensibility. The catalog provides strategic frameworks and identifies the questions you need to answer; it does not provide professional accounting, tax, or audit advice for your specific situation. The interpretations of ASC 606 for AI-native usage-based, outcome-based, and value-based contracts are still evolving among auditors and standard-setters. Engage a CPA with AI-native practice experience before signing your first non-subscription contract, before your first audit cycle, and before any material decision that depends on the rules below.
Approach 6 — Revenue Recognition for AI Contracts
Maturity: Proven. Beginner difficulty: Medium.
In Plain English. Revenue recognition is the accounting question of when revenue counts on the books. A customer signs a $1.2M one-year contract and pays $100K monthly; do you book $100K of revenue every month, or $1.2M on day one, or something else? The answer is governed by a global accounting standard called ASC 606 (in the US) or IFRS 15 (internationally). For traditional SaaS, the answer is straightforward: recognize revenue ratably over the contract period. For AI-native companies, it gets complicated — usage-based contracts, outcome-based contracts, and value-based contracts each have different recognition rules, and the rules are still being interpreted by auditors as the contract structures evolve.
Getting this right matters because it determines what the company tells investors, what the audit looks like, and what the P&L actually shows. Companies that get it wrong face material restatements during their first audit, surprise revenue holes during fundraising, and credibility damage with investors that takes years to repair.
Best treated as a foundational discipline at every stage. Cannot be deferred indefinitely; the moment a company has any revenue, ASC 606 applies.
Core idea. Apply the five-step ASC 606 framework — identify the contract, identify performance obligations, determine the transaction price, allocate the price to obligations, recognize revenue as obligations are satisfied — to AI contracts that frequently have variable consideration, multiple performance obligations, and outcome-dependent payments.
When to use it. Always, from the moment the company has any contracted revenue. The complexity of the application varies (Per-Seat is simple; Value-Based is complex), but the framework applies universally.
Mechanism. Traditional SaaS revenue recognition is simple because the contract is a single performance obligation (access to the software) delivered ratably over the contract term. Revenue equals contract price divided by contract length, recognized monthly. ASC 606 adds nothing controversial.
AI contracts complicate this in three structural ways. First, variable consideration: usage-based and outcome-based contracts have transaction prices that depend on customer behavior, which is not known at contract signing. ASC 606 requires the company to estimate variable consideration but constrains the estimate to the amount the company can support with reasonable reliability — typically much less than the contract's nominal upside until a track record is established. Second, multiple performance obligations: a hybrid contract bundling subscription plus usage plus outcome bonuses has three or more obligations, each requiring separate price allocation and separate recognition timing. Third, outcome dependency: in pure outcome-based contracts, revenue cannot be recognized until the outcome is delivered and confirmed — which can produce a six-to-twelve-month lag between contract signing and revenue recognition.
The practical implication is that an AI-native company's bookings (the contractual value of signed deals) and recognized revenue (the GAAP revenue on the P&L) diverge meaningfully. Bookings might be $5M for a quarter while recognized revenue is only $1.5M because the bulk of the contracts are outcome-based and revenue recognition is constrained to the conservative estimate. Investors and boards must learn to read both numbers; founders unfamiliar with the gap often misjudge the company's financial state.
Fictional walk-through. Imagine OutcomeAI, an AI customer-support company. In Q1, the company signs $4M in new annual outcome-based contracts at an average of $2/resolved-ticket, projecting roughly 2M tickets across its customer base. ASC 606 requires recognizing revenue only as outcomes are delivered. By the end of Q1, only 200K tickets have been resolved (deployment ramps slowly), producing $400K in recognized revenue. The company's bookings are $4M; the recognized revenue is $400K; the deferred revenue (contracts signed but not yet recognized) sits at $3.6M. The P&L shows $400K of revenue; the board needs to see all three numbers — bookings, recognized revenue, deferred revenue — to understand the business state. A founder who sees only the $400K recognized revenue and thinks the business is stagnating is wrong; a founder who sees only the $4M bookings and thinks the business has $4M of GAAP revenue is also wrong.
Example. Confirmed pattern: Every AI-native company with non-subscription contracts faces this complexity. Sierra, Decagon, and other outcome-priced companies report meaningfully different bookings and recognized revenue figures in their investor materials. Companies on pure subscription pricing (early Per-Seat or Per-Call) face simpler recognition but still must demonstrate ASC 606 compliance to auditors during fundraising or M&A.
Primary risk. Aggressive recognition that auditors later restate. The company recognizes revenue under optimistic assumptions about variable consideration; auditors disagree at year-end; revenue is restated downward; investors lose confidence. Mitigation: engage an AI-experienced revenue accountant before signing the first non-subscription contract; document the recognition policy formally; review the policy with auditors during the first audit cycle rather than after.
Secondary risk. Conservative recognition that hides growth. The company recognizes revenue too conservatively; the P&L looks weaker than the underlying business performance; investors and the board misjudge the company's trajectory. Mitigation: report bookings, deferred revenue, and recognized revenue separately and consistently; train investors and board members on how to read all three numbers.
First move. Read the FASB's ASC 606 standard (or have your accountant brief you). Document your company's revenue-recognition policy in a one-page memo. Review it with an external accountant before your first audit cycle.
Approach 7 — Compute COGS Accounting
Maturity: Proven. Beginner difficulty: Medium.
In Plain English. Compute COGS Accounting is how an AI-native company treats the cost of running its AI workloads on the income statement. Foundation-model API calls, GPU rentals, inference infrastructure, fine-tuning compute, and embedding generation are all costs that flow through cost of goods sold (COGS) — the line on the P&L that determines gross margin. Getting these costs classified correctly is the foundation of every margin metric the company will ever report.
Traditional SaaS hosting costs are small (typically 5–15% of revenue) [Industry benchmark], so the COGS line is conceptually unimportant. For AI-native companies, compute is often 30–60% of revenue [Emerging pattern], which makes COGS the most consequential line on the income statement. Mistakes in classification — capitalizing what should be expensed, or expensing what should be capitalized — produce gross-margin numbers that do not reflect economic reality.
Best treated as a foundational discipline at every stage. The classification rules are not optional; they affect every external metric the company reports.
Core idea. Classify compute costs correctly between cost of goods sold (which reduces gross margin) and operating expenses (which do not), and apply consistent treatment so margin trends reflect economic reality.
When to use it. Always, from the moment the company has compute costs. The complexity scales with the cost magnitude, but the discipline applies universally.
Mechanism. Compute costs in an AI-native company fall into three categories that get different accounting treatment.
Direct production compute — the cost of running the AI workloads that fulfill customer requests. Foundation-model API calls when serving customer queries, GPU inference when generating customer outputs, embedding generation for customer data. This category is unambiguously COGS — it is the cost of delivering the product, and it scales with revenue.
Product-development compute — the cost of training and fine-tuning models, evaluation runs, research experiments, and infrastructure work that improves the product but is not directly tied to customer requests. This category is generally R&D expense (operating expense, not COGS), though some companies capitalize fine-tuning costs as intangible assets when the resulting model has a defined useful life. The capitalization choice is consequential — capitalized costs do not reduce current-period earnings, while expensed costs do.
Internal-use compute — the cost of AI tools used by employees (engineering productivity, customer support tooling, sales enablement). This is operating expense, not COGS, regardless of magnitude.
The structural problem in AI-native companies is the gray zone between production and product-development compute. A team running an evaluation pipeline is doing both — producing data that improves future model performance (R&D) and validating the current production model (potentially COGS). A clear allocation policy, documented and applied consistently, is what auditors require.
The other accounting question is prepaid compute commitments. Companies that commit to large compute purchases from cloud providers (AWS Bedrock, Azure OpenAI, GCP) for discount pricing get the accounting treatment of any prepaid expense — booked as an asset on the balance sheet, expensed to COGS as the compute is consumed. Companies that buy reserved capacity for one or three years get even more complex treatment that may involve embedded leases under ASC 842.
Fictional walk-through. Imagine AgentCo, an AI agent platform with $5M ARR. The company spends $2M annually on compute: $1.5M on production inference (serving customer requests), $300K on training and evaluation, and $200K on internal employee tooling. Under correct classification, $1.5M flows through COGS (gross margin: 70% on the $5M revenue), $300K is R&D expense, and $200K is general operating expense. A founder who incorrectly puts all $2M into COGS reports gross margin of 60% — a significantly worse number that misrepresents the business. A founder who incorrectly puts only the production inference into COGS but excludes a portion of the inference compute that genuinely served customer requests (perhaps the team batched evaluation runs onto the same GPU pool) overstates gross margin. Both errors compound at scale; neither will survive an auditor's first review.
Example. Confirmed pattern: Every AI-native company has to develop compute-COGS classification policies. The Bessemer Cloud Index and a16z's writing on AI margins both reference the importance of consistent compute classification when comparing AI-native company margins.¹ Public AI companies (when they emerge) will have to disclose their classification policies in detail.
Primary risk. Inconsistent classification that masks margin trends. The company classifies compute one way in Q1 and another way in Q3; the resulting margin numbers are not comparable; investors lose confidence. Mitigation: document the classification policy formally; apply it consistently; review it with auditors during the first audit cycle.
Secondary risk. Capitalizing development compute aggressively to inflate near-term earnings. Some companies capitalize model training and fine-tuning costs as intangible assets, which improves near-term profitability at the cost of future earnings (the capitalized costs are amortized over the asset's useful life). Aggressive capitalization is a frequent audit-comment area. Mitigation: be conservative on capitalization; expense most development compute unless there is a clear, documented case for asset treatment.
First move. List every compute cost the company incurs. Classify each into production / product-development / internal-use. Document the classification rules in a one-page policy memo. Apply consistently from this point forward.
Approach 8 — Cohort Analysis with Model-Cost Decay
Maturity: Emerging. Beginner difficulty: Advanced.
In Plain English. Cohort Analysis tracks groups of customers acquired in the same period over time — how their revenue, retention, and gross margin evolve as they age. Traditional SaaS cohort analysis assumes unit costs are stable: a customer acquired in 2023 costs roughly the same to serve in 2026 as they did in 2023, so the cohort's gross margin is stable.
For AI-native companies, this assumption is wrong in a structurally important way. Foundation-model prices have fallen 30–60% per year for several years and continue falling [Emerging pattern: observed across major foundation-model providers 2023–2026; rate is driven by competition, hardware improvement, and architectural innovation, none of which are guaranteed to continue at the same pace]. A customer cohort acquired in 2023 at a 50% gross margin may be operating at a 70% gross margin in 2026 — not because the cohort has done anything different, but because the compute they consume costs less. AI-native cohort analysis requires explicitly modeling this model-cost decay, separating "cohort improvement from price changes" from "cohort improvement from customer behavior."
This is one of the most analytically sophisticated approaches in the catalog. It requires data infrastructure, finance discipline, and patience that early-stage companies typically do not have. But the companies that get it right see a fundamentally clearer picture of their unit economics than companies that ignore it.
Best as a discipline that develops gradually as the company matures, becoming essential by Series B. Most powerful in usage-based and outcome-based pricing models where compute is a meaningful share of cost.
Core idea. Track customer cohorts over time, separating the contribution of cohort behavior (retention, expansion) from the contribution of falling model costs (compute price decay) to understand the true underlying unit economics.
When to use it. When the company has at least 12–24 months of customer data with consistent measurement. When compute is a meaningful share of cost (typically 20%+ of revenue). When the finance team has the data infrastructure to track per-cohort gross margin over time.
Mechanism. Cohort analysis with model-cost decay separates two effects that traditional cohort analysis conflates.
Cohort behavior effect — does the cohort retain, expand, churn? Are heavy users getting heavier? Are light users dropping off? These are the questions traditional cohort analysis asks, and they remain critical.
Model-cost decay effect — how has the cost of serving the cohort changed since acquisition? If foundation-model prices have fallen 40% since the cohort was acquired, the gross margin on that cohort has improved by a corresponding amount even if customer behavior has not changed at all.
The methodology requires holding customer behavior constant (or measuring its change separately) while attributing margin changes to compute-price decay. Most companies do this by maintaining a "synthetic cost" baseline — the cost the cohort would have incurred at the original acquisition-period prices — and comparing actual current cost to the synthetic baseline. The difference is the model-cost decay benefit, which can be substantial.
The strategic implication is that AI-native companies have a built-in margin tailwind that traditional SaaS does not. Cohorts acquired today will be more profitable in 2028 than they are today, even with no change in customer behavior, because compute will be cheaper. Companies that model this effect explicitly can make better decisions about CAC payback (acceptable longer than traditional SaaS norms because the cohort gets more profitable over time), pricing reductions (the company can lower prices over time to drive growth without sacrificing margin), and capital allocation (compute-cost-decay is a real form of margin expansion that competes with revenue growth as a margin driver).
Fictional walk-through. Imagine Sigma, a $10M ARR AI company with usage-based pricing. The 2024 cohort was acquired at an average gross margin of 55%. By the start of 2026, the same cohort is operating at 72% gross margin. The naive interpretation: "the cohort has expanded usage and become more profitable." The cohort-with-model-cost-decay analysis reveals that customer behavior has changed marginally (7% margin contribution from increased usage and small price increases), but the dominant effect is model-cost decay (10% margin contribution from foundation-model prices falling). Sigma can now make informed decisions: hold prices steady and let margin expand further, lower prices and use the cost decay to accelerate growth, or invest the margin tailwind in expanding features. Without the analysis, Sigma might mistakenly attribute all of the margin improvement to its own pricing power and make decisions that do not survive the next round of model-price competition.
Example. Confirmed pattern: Public AI infrastructure companies and the larger AI-native vendors are increasingly running this analysis internally. Bessemer Venture Partners and a16z growth team writing reference the dynamic.² The discipline is still developing; canonical published case studies are limited.
Primary risk. Over-attributing margin improvement to cohort behavior when it is actually model-cost decay. Companies that do this mistake their pricing power, set targets they cannot defend when compute prices stabilize, and report investor metrics that do not survive scrutiny. Mitigation: maintain the synthetic-cost baseline rigorously; report cohort margin trends with explicit decomposition between behavior and decay.
First move. Pick one large customer cohort. Calculate its gross margin at acquisition and today. Calculate what its gross margin would be today at acquisition-period compute prices. The difference is your model-cost decay benefit on that cohort. Repeat across cohorts to build the full picture.
C. Planning & capital allocation
How an AI-native company looks forward — modeling the future, allocating capital, and structuring contracts in ways that anticipate the unique uncertainties of an AI business. These approaches are most consequential at the moments when capital decisions are made: fundraising, hiring sprints, infrastructure commitments, pricing changes.
Approach 9 — Pilot Economics & Contract Mechanics
Maturity: Proven. Beginner difficulty: Medium.
In Plain English. Most enterprise AI deals are not signed as full production contracts. They start as paid pilots — three-to-six-month engagements at a fraction of the production contract size, designed to prove the AI works before the customer commits to a multi-year deployment. The pilot economics are different from production economics: cost of delivery is higher (more hand-holding), contract size is smaller, and revenue recognition timing is different. Pilot economics deserve their own accounting and forecasting treatment.
Companies that account for pilots correctly see clearly which pilots convert to production and which do not. Companies that conflate pilot revenue with production revenue typically misjudge the health of their pipeline and forecast incorrectly.
Best for any company running enterprise sales motions (Sales Catalog Motions 7, 8, 9, 10). Most consequential at companies with average deal sizes above $50K, where pilots are the standard entry mechanism.
Core idea. Treat paid pilots as a distinct revenue category from production contracts, with their own conversion rates, delivery economics, and forecast modeling.
When to use it. When the company runs an enterprise sales motion that uses paid pilots as the standard entry mechanism. Typically applies to companies with average deal sizes above $50K and sales cycles longer than 60 days.
Mechanism. Pilot economics work because the operational reality of pilots is fundamentally different from production deployments. A pilot typically involves: a smaller contract size (10–25% of the projected production contract), a defined success-criteria document, a deployment period with high customer-success engagement, and a conversion decision at the end. The financial implications cascade through several areas.
Pilot revenue recognition: pilots are typically structured as fixed-fee engagements with defined deliverables. Revenue recognition under ASC 606 follows the deliverables — typically over the pilot period if the AI is providing ongoing service, or at completion if the pilot is structured as a research project with a defined output. The recognition pattern depends on the contract structure.
Pilot delivery economics: a pilot consumes a disproportionate amount of customer-success and engineering time relative to its revenue. Successful pilots often run at 80–120% direct cost (gross margin near zero or negative on the pilot itself), with the economics justified by the production contract that follows. Companies that treat pilot delivery costs as production COGS misclassify their gross margin; companies that capitalize pilot costs as a customer-acquisition investment may produce different (and arguably more accurate) financial pictures.
Pilot-to-production conversion modeling: not every pilot converts. Mature enterprise AI companies in 2026 typically see pilot-to-production conversion rates between 50% and 75% [Emerging pattern: based on disclosed data from enterprise AI vendors and investor research; lower bound common for first deployments, upper bound for category leaders with mature playbooks], depending on the buyer maturity and category. Forecasting models that assume 100% conversion overstate future revenue; models that ignore pilot economics entirely understate the operational complexity of the sales motion.
The accounting question of whether pilot revenue counts as ARR is genuinely contested. Some companies include it as ARR with a note about pilot composition; others exclude it and report only production-contract ARR. The consensus among investors is increasingly toward exclusion — pilot revenue is not "annual recurring" because the recurrence is conditional on conversion. Companies that include pilot revenue in their ARR figures during fundraising face increasing skepticism from sophisticated investors.
Fictional walk-through. Imagine MedAI, an AI tool for hospital systems. MedAI's standard enterprise motion: a 90-day paid pilot at $50K, followed by a production contract at $400K/year if successful. In 2026, MedAI signs 12 pilots ($600K total pilot revenue), of which 8 convert to production contracts ($3.2M production ARR added). The naive financial picture: $3.8M new revenue. The pilot-economics-adjusted picture: $600K pilot revenue (recognized as delivered, not annualized), 8 production conversions producing $3.2M new ARR, 4 pilots that did not convert (sunk cost in customer-success investment, lessons for future targeting). The pilot-to-production conversion rate of 67% becomes a tracked metric that informs sales-motion design.
Example. Confirmed pattern: Most enterprise AI vendors — Glean, Harvey, Sierra, Cresta, Writer — run pilot-first motions and track pilot-to-production conversion as a board-level metric. The accounting and reporting treatment varies; sophisticated investors increasingly request explicit pilot-versus-production breakdowns during diligence.
Primary risk. Including pilot revenue in ARR figures, then losing investor trust when the conversion rate becomes visible. Mitigation: report pilot revenue separately from ARR in all investor materials. Include the pilot-to-production conversion rate as a standard reported metric.
First move. Define what a pilot is in your company's commercial structure (size threshold, duration, conversion criteria). Track pilots as a separate revenue category from production contracts in your books. Report pilot revenue and conversion rate to your board separately from ARR.
Approach 10 — Forecasting Under Falling Compute Costs
Maturity: Emerging. Beginner difficulty: Advanced.
In Plain English. Building a 12–24 month financial forecast for an AI-native company requires explicitly modeling something traditional SaaS forecasts ignore: the foundation-model prices that determine your COGS will fall meaningfully over the forecast period. A 2026-period forecast that assumes constant compute prices will be wrong in a structurally important way — it will understate margin in the out-quarters, which will produce misleading runway projections and misguide strategic decisions.
Forecasting under falling compute costs requires building a separate model layer for compute prices alongside the customer-revenue model layer. The two combine to produce gross margin and contribution margin forecasts that reflect the actual economic trajectory of the business.
Best for any company with meaningful compute spend (typically 20%+ of revenue). Most consequential at companies preparing for major capital decisions (Series A, Series B, large hiring sprints, infrastructure commitments).
Core idea. Build the forecast with two explicit layers — a customer-revenue model and a compute-price model — and combine them to produce margin projections that anticipate the falling-cost trajectory of foundation models.
When to use it. When the company has compute spend exceeding 20% of revenue. When the forecast period is longer than 12 months. When major capital decisions are imminent (fundraising, large hires, infrastructure commitments).
Mechanism. A traditional SaaS forecast model has one revenue layer (subscription growth, churn, expansion) and one cost layer (compute, sales, marketing, R&D, G&A). Compute is typically modeled as a percentage of revenue or a fixed-cost-plus-growth model.
An AI-native forecast model adds a third layer: the compute-price model. This layer projects how foundation-model prices will evolve over the forecast period. The standard approach uses observed price decay rates (typically 30–60% per year for the major model providers between 2023 and 2026) and projects forward, with sensitivity analysis around the assumed decay rate.
The combined forecast produces gross-margin trajectories that often look surprising. A company with a flat 55% gross margin today may project a 65% gross margin in 18 months and a 70% gross margin in 36 months — entirely from compute-price decay, with no change in customer pricing or behavior. This creates strategic options the company would not see with a flat-margin forecast: pricing reductions to drive growth (the margin tailwind absorbs the impact), expanded feature investment (the future cost base is lower), or simply higher target margins that are credible with investors.
The most common failure mode is over-optimism on the compute-price decay rate. Foundation-model prices have fallen rapidly between 2023 and 2026, but the rate is not guaranteed to continue. The decay is driven by competition between providers (which can stabilize), Moore's-Law-style hardware improvements (which are slowing), and architectural innovations (which are unpredictable). Mature forecast models include multiple scenarios: aggressive decay (50%/year), base case (30%/year), and conservative (10%/year), with explicit sensitivity analysis.
The other constraint is the data infrastructure to track compute prices systematically. Foundation-model providers change pricing frequently; the company must monitor changes across providers, document the price trajectory, and update forecasts as pricing changes. Companies that try to do this in spreadsheets typically fall behind; companies that build the tracking into their FP&A infrastructure stay current.
Fictional walk-through. Imagine GenStudio, an AI image-generation company at $8M ARR with $3M annual compute spend (37.5% of revenue, 62.5% gross margin). The team is forecasting for a Series B fundraise, projecting 18 months out. A traditional forecast assumes compute costs remain at 37.5% of revenue; the projected gross margin in 18 months stays at 62.5%, and the company projects to $30M ARR. With the compute-price-decay layer added (assumed 35%/year decay rate, base case), the projected compute spend in 18 months is $3M × (1 − 0.35)^1.5 ≈ $1.5M against the projected $30M revenue — a gross margin of 95%. That is unrealistically high; the model needs refinement (usage will likely grow with revenue, partially offsetting the decay benefit). The realistic picture sits somewhere between 70% and 80% gross margin in 18 months. Either way, the forecast picture differs meaningfully from the naive flat-margin assumption, and the strategic implications differ accordingly.
Example. Emerging pattern: Sophisticated AI-native companies preparing for Series B and beyond increasingly model compute-price decay explicitly. The discipline is too young to have widely-published case studies, but Bessemer and a16z have both published research that references the dynamic.² Public companies (when they emerge in larger numbers) will face investor questions about their compute-price assumptions in forward guidance.
Primary risk. Over-optimism on decay rate. Aggressive decay assumptions produce optimistic forecasts that do not survive contact with actual pricing dynamics. Mitigation: model multiple scenarios (aggressive, base, conservative); use the conservative case for runway planning and the base case for strategic targets.
First move. Calculate your compute spend as a percentage of revenue for each of the last six quarters. Document the foundation-model price changes that affected your costs over that period. Project forward with a base-case decay rate (30%/year is reasonable as a starting assumption) and run sensitivity analysis at ±20%.
Approach 11 — Capital Allocation
Maturity: Proven. Beginner difficulty: Medium.
In Plain English. Capital Allocation is the strategic question of how to split the company's incremental dollars across competing demands: more compute to scale the product, more engineers to ship features, more salespeople to grow revenue, more marketing to fill the funnel, or more cash reserves to extend runway. Every meaningful financial decision an AI-native company makes is a capital-allocation decision in some form.
The dimension that makes AI-native capital allocation different from traditional SaaS is the compute spend curve. Compute is a variable cost that scales with usage, but it is also subject to the strategic choice of how aggressively to optimize. A team can spend the same dollars on either: more compute to serve more customers at current efficiency, or engineering work to reduce per-call compute cost (which expands future margins). The trade-off between "scale at current efficiency" and "invest in efficiency" is a strategic decision that traditional SaaS does not have to make at the same intensity.
Best as a discipline that develops gradually as the company scales, becoming essential by Series A and central by Series B.
Core idea. Treat every incremental dollar as a strategic choice across compute, people, customer acquisition, and runway, with explicit framework for how the choice is made.
When to use it. From Series A onward, as the company has enough capital to require systematic allocation rather than ad-hoc spending decisions. Most consequential at moments when the capital base changes (fundraises, large customer payments, M&A).
Mechanism. Most AI-native companies in 2026 face four competing demands for incremental capital.
Compute: pay for more foundation-model API calls, more GPU rentals, more training runs, more inference capacity. Compute spend grows roughly with revenue if the architecture is unchanged, faster than revenue if the company adds more compute-intensive features.
People: hire more engineers, sales reps, marketers, customer-success professionals. People spend grows with company complexity; the rule of thumb in mature SaaS is roughly $200K–$400K per employee per year fully loaded (salary, benefits, equipment, allocated overhead) in major US tech hubs.
Customer acquisition: paid marketing, sales-development resources, partnership investments, channel programs. CAC spend grows with growth ambitions; the question is whether the LTV/CAC math justifies the spend.
Runway: cash kept on the balance sheet. Runway has strategic value — it gives the company optionality to pivot, weather downturns, and avoid raising capital under unfavorable terms. Most companies under-value runway in growth phases; some companies over-value it and starve growth investments.
The key strategic concept here is the "Burn Multiple" (popularized by David Sacks): the ratio of cash burned to net new ARR added. A company with a $5M annual burn that adds $5M of new ARR has a Burn Multiple of 1.0; lower is better. Mature SaaS norms suggest healthy Burn Multiples are 1.5x or below [Industry benchmark]; AI-native companies often run higher because of the compute-cost component, with 2.0x considered acceptable for early-stage growth-mode companies [Emerging pattern].
The AI-specific capital-allocation question that traditional SaaS does not face is whether to invest in compute efficiency or product scaling. Engineering time spent optimizing prompts, batching inference, distilling smaller models, or building custom inference infrastructure can produce meaningful margin improvements (often 20–40% reduction in per-call costs) — but the same engineering time could be spent shipping features that drive revenue growth. The right answer depends on the company's stage, the magnitude of the margin opportunity, and the customer-pull on new features.
Fictional walk-through. Imagine FlexAI, a Series B AI company with $50M in fresh capital. The leadership team must allocate the capital across the four demands. The default allocation, based on standard SaaS playbooks, might be: $20M to people growth (scaling sales and engineering), $15M to customer acquisition, $10M reserved for runway, $5M to compute. The AI-native-aware allocation might shift this: $15M to people growth, $12M to customer acquisition, $10M to compute (anticipating revenue growth), $8M to compute-efficiency engineering, $5M to runway. The shift from $5M to $8M in efficiency engineering reflects the strategic bet that 30% margin improvement on a future $100M revenue base is worth $30M annually — a payoff that justifies even significant up-front investment.
Example. Confirmed pattern: AI-native companies preparing capital-allocation plans during Series B and beyond increasingly explicitly weigh compute-efficiency engineering against alternative uses of capital. Public discussion of the discipline is limited; the practice is documented in board meetings and capital plans rather than published reference.
Primary risk. Compute over-investment. Companies allocate too aggressively to compute capacity, producing capacity that exceeds demand and depressing margins. Mitigation: allocate compute capacity in line with demonstrated demand, with explicit triggers for scale-up rather than committed capacity.
Secondary risk. Compute-efficiency under-investment. Companies fail to invest in compute efficiency, leaving 20–40% margin improvements on the table. Mitigation: run quarterly reviews of compute-efficiency engineering opportunities; allocate engineering capacity explicitly rather than letting feature work crowd out efficiency work.
First move. Build a one-page capital-allocation framework for your company. Identify the four (or however many) demands that compete for capital. Document the principles that guide the allocation. Review the framework quarterly.
D. External reporting
How the company talks to its investors, board, and auditors. The metrics, dashboards, and disclosures that AI-native companies report — and which differ meaningfully from traditional SaaS norms.
Approach 12 — Investor & Board Reporting
Maturity: Proven. Beginner difficulty: Medium.
In Plain English. Investor & Board Reporting is the discipline of distilling the company's financial state into the metrics, dashboards, and narratives that investors, board members, and auditors expect. For traditional SaaS, the canonical metrics are well-established: ARR, NRR, gross margin, CAC payback, Burn Multiple, Magic Number. For AI-native companies, the same metrics apply, but they have to be supplemented with AI-specific metrics that traditional SaaS does not require.
Companies that report only the traditional SaaS metrics produce financial pictures that miss the AI-native dynamics — model-cost decay, outcome-attribution risk, pilot-to-production conversion, compute-as-percentage-of-revenue. Companies that report only AI-specific metrics fail to compare meaningfully against traditional SaaS benchmarks and produce confusion among investors who anchor on those benchmarks. The right answer is reporting both, with explicit context about how the metrics relate.
Best as a discipline that develops gradually with company maturity. Most consequential during fundraising, board meetings, and audit cycles.
Core idea. Report the canonical SaaS metrics that all investors expect, supplemented with the AI-specific metrics that capture the dynamics traditional SaaS does not.
When to use it. From Series A onward. Pre-revenue companies can defer most of this, though basic burn-and-runway reporting begins from inception.
Mechanism. A complete AI-native company financial report typically includes the following metrics, organized into three tiers.
*Tier 1 — Canonical SaaS metrics that investors expect for any subscription-flavored business.*³ ARR (annual recurring revenue), NRR (net revenue retention), GRR (gross revenue retention), gross margin, contribution margin, CAC payback period, Burn Multiple, cash runway in months. These are the baseline; every investor will ask for them, and AI-native companies report them like any other SaaS.
Tier 2 — AI-specific metrics that capture the AI-native dynamics. Compute as percentage of revenue (the most important AI-specific margin metric, typically 20–60% in current AI-native companies). Cohort gross margin trend (whether margins are improving over time, decomposed between behavior and model-cost decay). Pilot-to-production conversion rate (for companies running enterprise sales motions). Outcome attribution accuracy (for companies on per-outcome pricing, the percentage of contracted outcomes that the team can defend with audit-grade telemetry). Bookings vs. recognized revenue (for companies with non-subscription contracts, the gap between contracted value and GAAP revenue). Model-cost-decay benefit (the margin improvement attributable to falling foundation-model prices, separated from cohort behavior).
Tier 3 — Strategic context that AI-native companies frequently include. Compute concentration risk (percentage of compute spend at single foundation-model providers, capturing dependency on Anthropic, OpenAI, etc.). Forecast accuracy (actuals vs. forecast across the last 4–8 quarters, demonstrating the team's predictive maturity). Capital allocation breakdown (how incremental capital is being split across compute, people, acquisition, and runway).
The constraint is reporting overhead. Producing a complete report monthly requires meaningful FP&A capacity; producing it quarterly with appropriate depth requires a controller and a senior analyst. Companies that try to report everything monthly typically produce shallow reports; companies that report quarterly with depth produce more useful reports.
Fictional walk-through. Imagine GrowthAI, a Series B AI company. Their quarterly board report includes Tier 1 metrics (ARR $25M, NRR 130%, gross margin 65%, Burn Multiple 1.4x, runway 24 months), Tier 2 metrics (compute 28% of revenue down from 35% a year ago, cohort gross margin trending up at 2 points/quarter with explicit decomposition, pilot-to-production 70%), and Tier 3 context (90% of compute spend with two providers, last-eight-quarters forecast accuracy at ±8%, $50M capital deployment plan). The report runs 12 pages with explicit narrative around each metric. Investors and board members read the report in 30 minutes and have informed questions for the meeting; the dynamics that matter are visible without requiring board members to dig.
Example. Confirmed pattern: Sophisticated AI-native companies preparing for or running through Series B and beyond increasingly produce reports that include Tier 2 and Tier 3 metrics. The format varies; the underlying discipline is similar across companies.
Primary risk. Vanity metrics over substance. The team reports impressive-sounding numbers (signed bookings, total contract value, total registered users) that do not reflect the underlying business state. Mitigation: anchor reporting on cash, recognized revenue, and gross margin first; supplement with bookings and pipeline only with explicit context.
First move. List the metrics your last board report included. Compare against the Tier 1, Tier 2, and Tier 3 lists above. Identify two or three additions that would meaningfully improve the report.
E. Metrics & KPI framework
The previous four sections cover what AI-native finance does (price, account, plan, report). This section covers what AI-native finance measures — the specific metrics and KPIs that determine whether an AI-native company is succeeding, organized into a hierarchy that runs from the operational layer (per-AI-worker performance) up through the unit-economics layer (per-customer or per-outcome profitability) up to the company-level financial layer (gross margin, ARR, runway) and finally to the investor-facing layer (Burn Multiple, capital efficiency).
This section is the most prescriptive in the catalog. The previous approaches give you architectural choices; this section gives you the numbers you should actually be tracking, the formulas to calculate them, the thresholds that distinguish healthy from unhealthy, and a worked example dashboard for an AI-native company at $10M ARR.
The metrics hierarchy
Every AI-native company's financial reality emerges from a four-layer hierarchy of metrics. Each layer feeds the layer above it.
Layer 1 — AI Worker operational metrics. The performance of the AI itself — outcomes produced, accuracy, escalation rates, throughput. These are engineering and product metrics that finance traditionally has not engaged with, but for AI-native companies they are the upstream drivers of every financial number. An AI Worker with a 90% outcome rate and a 5% escalation rate produces fundamentally different unit economics than one with a 60% outcome rate and a 35% escalation rate, regardless of how the contract is priced.
Layer 2 — Unit economics. Per-customer or per-outcome profitability. Contribution margin per outcome, gross margin per call, customer LTV, CAC per cohort, LTV/CAC ratio. These metrics translate Layer 1 operational performance into financial signal — a high escalation rate (Layer 1) shows up as low gross margin per outcome (Layer 2).
Layer 3 — Company-level financial metrics. The aggregate financial state of the company. ARR, NRR, gross margin, contribution margin, cash burn, runway. These are the metrics on the income statement and the cash-flow report — the GAAP view of the business. They aggregate Layer 2 unit economics across all customers and time periods.
Layer 4 — Investor and capital-efficiency metrics. The metrics that compare the company against benchmarks, drive valuation, and inform fundraising. Burn Multiple, Magic Number, Rule of 40, ARR per employee, capital efficiency ratios. These are derived from Layer 3 financials but emphasize efficiency and benchmarking rather than absolute performance.
The key insight for AI-native finance teams: companies that report only Layer 4 metrics (the easiest to produce) are flying blind on what's actually driving the business. The diagnostic information lives in Layers 1 and 2; the strategic narrative lives in Layer 3; the investor pitch lives in Layer 4. Mature finance functions report all four layers, with explicit causal connections between them.
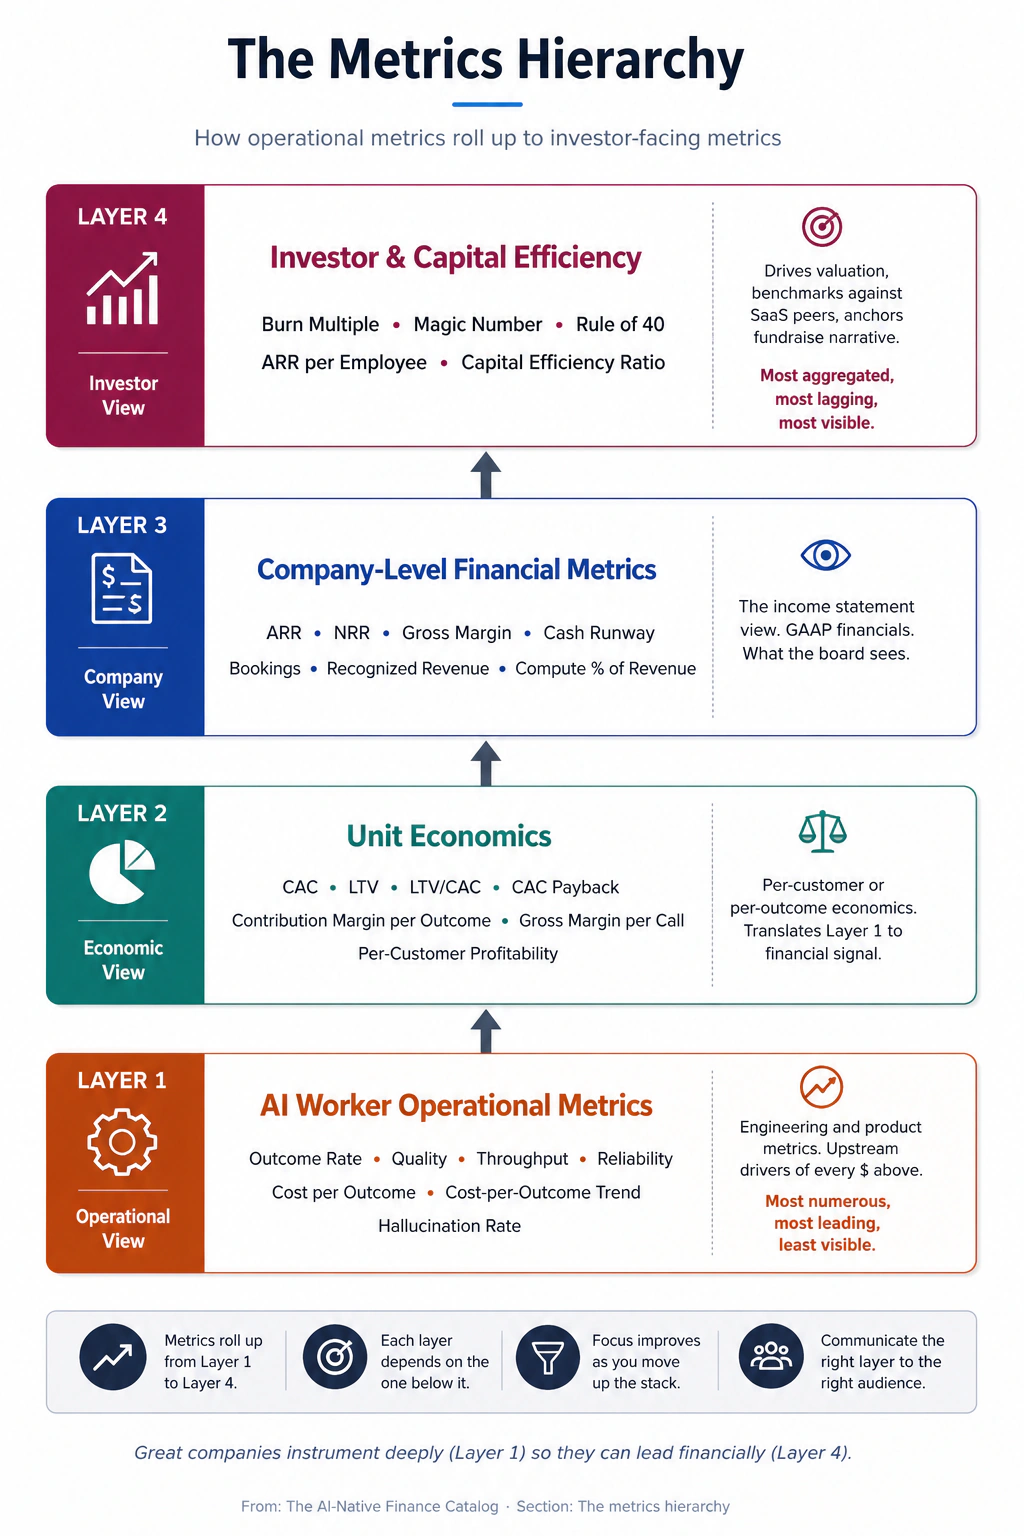
AI Worker operational KPIs
The Layer 1 metrics — performance of the AI itself — are the most novel and the least covered in traditional finance literature. Yet they are the upstream drivers of every financial KPI. A company that tracks these well sees gross-margin trends three to six months before they show up in the P&L; a company that ignores them is reactive to financial outcomes it cannot explain.
Six core AI Worker operational metrics apply across most worker types:
1. Outcome rate. The percentage of attempts that produce a successful outcome. For a customer-support AI: tickets resolved without escalation divided by total tickets received. For a sales-outreach AI: meetings booked divided by total messages sent. For a code-generation AI: generated code accepted by human reviewer divided by total generation attempts.
Outcome rate = Successful outcomes / Total attempts
Healthy ranges vary dramatically by worker type. Customer support: 60–85%. Sales outreach: 2–15% (much lower because the buyer-side response rate is the bottleneck). Code generation: 30–70%. The baseline is the human-only rate; the AI Worker is succeeding if it consistently exceeds the baseline at meaningfully lower cost.
2. Quality. Human-rated or auditor-rated quality of the outcome the AI produced. For customer support: post-resolution customer satisfaction (CSAT) scores. For document analysis: percentage of analyzed documents marked correct on audit sample. For meeting summarization: percentage of decisions and action items captured correctly.
Quality = Average rated score (1–5 or 1–10 scale) across audited outcomes
The gap between outcome rate and quality is operationally important. An AI with a 90% outcome rate and a 60% quality score is producing a lot of bad outcomes that are technically "outcomes." The two metrics together give the truth.
3. Throughput. Outcomes produced per unit time. Tickets resolved per hour, summaries generated per minute, claims processed per day. Throughput becomes financially relevant when compared against human throughput in the same workflow — the multiple is a measure of automation leverage.
Throughput = Outcomes / Time period
Automation leverage = AI throughput / Human throughput
A typical AI Worker doing structured tasks (claims, document analysis, simple support) shows automation leverage of 5–20x compared to human equivalents. AI Workers doing creative or judgment-heavy tasks show 2–5x. AI Workers doing tasks that require context the AI cannot access show automation leverage near 1x and probably should not be deployed.
4. Reliability. The consistency of the AI Worker's performance — uptime, error rate, behavior under unusual inputs. Includes infrastructure reliability (uptime) and behavioral reliability (consistency of outcomes across similar inputs).
Reliability = (Uptime %) × (1 − Error rate) × (Behavioral consistency score)
Reliability is the metric that determines whether the AI Worker can be trusted in production. An AI with high outcome rate but variable behavior across similar inputs is not deployable in regulated industries, no matter how good the average performance is.
5. Cost per outcome. The fully-loaded cost of producing one outcome, including foundation-model API costs, supporting infrastructure, monitoring, and proportional engineering and customer-success time.
Cost per outcome = (Compute cost + Infrastructure cost + Allocated overhead) / Total outcomes produced
This is the most important Layer 1 metric for finance, because it directly drives gross margin per outcome (Layer 2). Customer-support AI typical range: $0.20–$0.80 per resolved ticket. Sales-outreach AI: $0.50–$3 per meeting booked. Code-generation AI: $0.10–$1 per accepted code suggestion.
6. Cost-per-outcome trend. The rate of change in cost per outcome over time. Should fall over time as foundation-model prices decay (30–60% per year), as the team optimizes prompts, and as caching and batching improve efficiency. A flat or rising trend indicates a problem — likely one of: model-cost-decay benefits not being captured (still using pricier models), workflow drift (the AI is being asked to do harder things over time), or infrastructure inefficiency.
Cost-per-outcome trend = (Cost per outcome this period − Cost per outcome prior period) / Cost per outcome prior period
A healthy AI Worker shows cost-per-outcome decay of 20–40% per year [Author thesis: derived from observed model-price decay plus typical prompt-optimization gains; should be validated against your own deployment]. This decay is the operational analog of the model-cost-decay margin tailwind discussed in Approach 8.
The six metrics together answer the operational question: is this AI Worker succeeding, by what margin is it succeeding, and is the success improving over time? Companies that track these metrics for each AI Worker in production have early warning of margin issues, customer-success problems, and competitive pressure. Companies that don't track them learn about the same issues from the financial statements three to six months later — when they're harder to fix.
Per-architecture financial KPIs
Each pricing architecture from Section A has its own set of financial KPIs that determine whether the architecture is working. The metrics overlap but the emphasis differs.
Per-Seat Pricing KPIs. The metrics that matter when revenue scales with seats:
- Seats sold (gross), seats churned (gross), net seats added — the basic flow metrics for any per-seat business
- Seat utilization rate — percentage of paid seats with monthly active usage; healthy ranges 60–85%, below 50% indicates substantial billing-without-value risk
- ARPU (Average Revenue Per User) — total revenue divided by active users
- ARPA (Average Revenue Per Account) — total revenue divided by paying accounts
- Compute cost per seat — the AI-specific addition; this is the primary indicator of margin compression on heavy users
- Compute-cost-per-seat distribution — heavy/medium/light user breakdown; if heavy-user compute exceeds 80% of seat revenue, the architecture needs evolution
Seat utilization rate = Active users / Paid seats
ARPU = Total revenue / Active users
Compute cost per seat = Total compute cost / Paid seats
Per-Call / Usage Pricing KPIs. Metrics that matter when revenue scales with consumption:
- Active customers — customers with any billable usage in the period
- Calls per active customer — usage intensity per customer
- Revenue per call — average revenue across all billable calls
- Gross margin per call — (Revenue per call − Cost per call) / Revenue per call; should hold 60%+ structurally
- Customer concentration — percentage of revenue from top 5/10/20 customers; over 30% from top 5 indicates concentration risk
- Usage growth rate — month-over-month increase in calls per customer; healthy: 5–15% MoM in early-product phase
- Bill-shock churn rate — customers churning specifically after a billing surprise; over 5%/year indicates inadequate customer-success on bill management
Calls per active customer = Total billable calls / Active customers
Gross margin per call = (Revenue per call − Cost per call) / Revenue per call
Customer concentration (top 5) = Revenue from top 5 customers / Total revenue
Per-Outcome Pricing KPIs. Metrics specific to outcome-based architectures:
- Outcomes delivered per period — the volume metric; the upstream driver of revenue
- Outcome attribution accuracy — percentage of delivered outcomes the team can defend with audit-grade telemetry; should be 95%+
- Outcome dispute rate — percentage of billable outcomes that customers dispute; over 3% indicates attribution-infrastructure problems
- Average revenue per outcome — the price the company captures per outcome
- Cost per outcome — total cost (compute + supporting infrastructure + allocated overhead) per outcome
- Contribution margin per outcome — (Revenue per outcome − Variable costs per outcome) / Revenue per outcome
- Customer outcome consumption growth rate — usage trajectory by customer
Contribution margin per outcome = (Revenue per outcome − Variable costs per outcome) / Revenue per outcome
Outcome attribution accuracy = Outcomes with audit-grade telemetry / Total outcomes billed
Value-Based Pricing KPIs. Metrics for the most sophisticated architecture:
- Baseline measurement period results — the customer's pre-deployment metrics
- Measured value vs. baseline — the gap that drives billing
- Value-share capture rate — vendor's share of the measured gap; typically 5–25%
- Audit completion rate — percentage of contracts with completed audit cycles; below 80% indicates the audit-rights infrastructure is broken
- Variable consideration recognition rate — percentage of contracted upside actually recognized as revenue; in early years often as low as 30–50% due to ASC 606 conservatism, rising as track record matures
- Customer renewal rate at contract end — these contracts have natural expiration cliffs; renewal rate is the durability test
Hybrid Pricing KPIs. Metrics that matter when multiple components combine:
- Subscription-vs-usage revenue split — percentage of revenue from each component; tracking how the mix evolves
- Overage rate — percentage of customers exceeding their included quota; healthy: 30–60% indicates pricing is calibrated correctly
- Average overage revenue per overage customer — the upside on heavy users
- Conversion to higher tier — percentage of overage customers upgrading to higher subscription tiers
- Bill predictability score — variance in monthly bills per customer; lower variance produces lower churn
Stage-by-stage metric priorities
Different metrics matter at different stages of company maturity. A pre-revenue company that obsesses over Burn Multiple is wasting time; a Series B company that has not graduated past tracking ARR is reporting too thin.
Pre-revenue (Seed).
Top 3 metrics: cash runway (in months), monthly burn (dollars), lead indicators (waitlist signups, design-partner conversations, beta users). Skip everything else. ARR, NRR, gross margin, CAC are not yet meaningful — there is too little data, the patterns will change in the next quarter, and the time spent calculating them is better spent winning the next customer.
Early revenue ($1M–$5M ARR).
Top 5 metrics: ARR, gross margin (with explicit compute-cost line), cash runway, NRR (gross + net), CAC payback period. Begin tracking; do not yet optimize. The metrics establish the baseline that will drive Series A diligence; their first-year values are less important than their trajectory and the team's ability to explain them.
Mid stage ($5M–$25M ARR).
Top 7 metrics: above plus Burn Multiple, contribution margin, pilot-to-production conversion (if enterprise sales motion), compute as percentage of revenue. Beginning to matter: cohort analysis with model-cost decay, customer concentration. The transition from "tracking metrics" to "optimizing metrics" happens in this stage; the finance function moves from scorekeeping to strategic input.
Scaling ($25M+ ARR).
Full Tier 1, Tier 2, and Tier 3 from Approach 12. All metrics matter. The strategic question is reporting cadence — which metrics are reviewed weekly (cash, pipeline, top-customer health), monthly (full P&L, gross margin trends, cohort analysis), quarterly (full investor report including all three tiers), and annually (audit, full strategic financial review).
The most common stage-related mistake is reporting Series B metrics at Series A scale. A pre-product-market-fit company that produces a 14-page board deck with cohort analyses, capital efficiency ratios, and Rule of 40 calculations is performing finance theater. The board wants to see runway, burn, and the customer count; everything else is overhead at that stage.
AI-specific operational efficiency KPIs
These are the engineering-finance bridge metrics — metrics that engineering and finance must track together because they directly determine unit economics. Traditional SaaS finance does not engage with these because hosting costs are too small to matter; AI-native finance must.
Cost per token (input vs. output). The unit cost of foundation-model API calls. Track separately for input tokens (prompt) and output tokens (response) because pricing differs by an order of magnitude across providers. Track over time because foundation-model pricing changes frequently — a quarterly snapshot misses the dynamics.
Inference cost per query. Total compute cost (foundation-model API + supporting compute) divided by total queries served. The single most important AI-specific operational metric, because it directly determines gross margin per call (Layer 2).
Inference cost per query = (Foundation-model API cost + Supporting compute cost) / Total queries served
Cache hit rate. For systems with response caching, the percentage of requests served from cache vs. requiring full inference. A 30% cache hit rate produces meaningful cost savings; a 60%+ cache hit rate transforms the unit economics.
Batch processing efficiency. For workloads that can be batched (overnight processing, retry queues, bulk operations), the cost per outcome when batched vs. real-time. Batched costs typically run 50–80% below real-time costs; companies that fail to batch-eligible workloads leave substantial margin on the table.
Model utilization rate. For self-hosted infrastructure, GPU utilization percentage. Below 40% indicates over-provisioned infrastructure; sustained 80%+ indicates capacity-planning needs attention.
Prompt token efficiency. Output value generated per input token consumed. A measure of prompt design quality — efficient prompts produce high-value outputs from minimal input context.
Time-to-first-token / time-to-completion. Performance metrics that affect customer experience and (for some workloads) determine whether the AI Worker can compete with human alternatives at all.
Capital efficiency metrics beyond Burn Multiple
The Burn Multiple is one metric in a broader capital-efficiency framework. AI-native companies should track and report against a fuller set:
ARR per employee. Total ARR divided by total full-time employees (including contractors converted to FTE-equivalent). The most direct measure of revenue productivity. Mature SaaS targets $200K–$400K per employee; AI-native companies in the $5M–$25M ARR range typically run $150K–$300K per employee — slightly lower due to higher engineering intensity.
ARR per employee = Total ARR / Total FTEs
Gross profit per employee. ARR per employee multiplied by gross margin. Adjusts for the AI-native lower-gross-margin reality and produces a more comparable metric across SaaS and AI-native companies.
Gross profit per employee = (Total ARR × Gross margin) / Total FTEs
R&D as percentage of revenue. Research and development spend (engineering, product, design) divided by revenue. AI-native norms typically 35–55% in growth phases (higher than SaaS norms of 25–40%) due to engineering intensity and the AI Finance Engineer / AI Outcome Engineer roles. Falls toward SaaS norms as the company scales.
S&M as percentage of new ARR. Sales and marketing spend in a period divided by net new ARR added in the same period. The reciprocal of the Magic Number; lower is better. Mature SaaS targets 100–150% (S&M dollar produces $0.67–$1 of net new ARR within the period); AI-native companies often run 80–120% in early stages because of stronger product-led acquisition.
G&A as percentage of revenue. General and administrative spend divided by revenue. Mature SaaS norms 10–15%; AI-native norms similar. Above 20% indicates organizational bloat or premature CFO/finance build-out.
Rule of 40. Annual revenue growth rate plus EBITDA margin. The canonical SaaS efficiency benchmark; mature companies should exceed 40%. AI-native companies in growth phase often run below this threshold (high growth offset by deep operating losses) and graduate toward Rule of 40 as they scale.
Rule of 40 = Annual revenue growth % + EBITDA margin %
Rule of 50/60 for fast-growing AI-native companies. Some AI-native investors apply a Rule of 50 or Rule of 60 for hypergrowth AI-native companies — accepting deeper losses in exchange for faster growth. Less universally adopted than Rule of 40 but increasingly referenced.
Capital efficiency ratio. Total ARR divided by total capital raised to date. A measure of how productively the company has deployed its fundraised capital. Mature SaaS targets 1.5x or higher; AI-native companies in early stages often run 0.5–1.0x and improve over time.
Capital efficiency ratio = Total ARR / Total capital raised
Worked example: AgentCo at $10M ARR
To make this framework concrete, consider a fictional AI-native company at $10M ARR. The metrics below represent a healthy mid-stage AI-native company; deviations from these benchmarks indicate where to look for problems or opportunities.
Company profile. AgentCo is an AI customer-support automation company. Pricing is hybrid: $5,000/month subscription per customer (includes 50,000 resolved tickets per month) plus $0.50 per ticket above the included quota. 100 customers, average $100K ACV. 50 employees. 18 months past Series A close ($30M raised); preparing for Series B in 12–18 months.
Annual P&L.
| Line item | Amount | % of revenue |
|---|---|---|
| Bookings (signed contracts) | $14M | 140% |
| Revenue (recognized GAAP) | $10M | 100% |
| COGS | ||
| Compute (foundation-model API) | $2.5M | 25% |
| Hosting & infrastructure | $400K | 4% |
| Customer-success allocation (variable) | $600K | 6% |
| Total COGS | $3.5M | 35% |
| Gross profit | $6.5M | 65% |
| Operating expenses | ||
| R&D (20 engineers) | $4M | 40% |
| Sales & Marketing | $3.5M | 35% |
| G&A | $2M | 20% |
| Total OpEx | $9.5M | 95% |
| Operating loss | ($3M) | (30%) |
| Cash burn (after working-capital benefit) | ($2.5M) | (25%) |
| Cash on hand | $25M | — |
| Runway | 10 years at current burn | — |
Layer 1 — AI Worker operational metrics.
| Metric | Value | Healthy? |
|---|---|---|
| Outcome rate (tickets resolved without escalation) | 78% | Yes (60–85% range) |
| Quality (CSAT post-resolution) | 4.4 / 5 | Yes |
| Throughput (resolutions per hour) | 120 | Yes (vs. human 8/hr = 15x leverage) |
| Reliability (uptime × consistency) | 99.5% × 96% = 95.5% | Yes |
| Cost per outcome | $0.42 | Yes ($0.20–0.80 range) |
| Cost-per-outcome trend (YoY) | −28% | Yes (within 20–40% target) |
Layer 2 — Unit economics.
| Metric | Value | Healthy? |
|---|---|---|
| ACV (Average Contract Value) | $100K | — |
| CAC | $50K | — |
| LTV (5-year, with 130% NRR) | $500K | — |
| LTV/CAC ratio | 10x | Excellent (target > 3x) |
| CAC payback period | 14 months | Healthy (target < 18 months) |
| Contribution margin per ticket resolved | 16% (revenue $0.50, cost $0.42) | Tight; room for compute optimization |
| Contribution margin per customer (full bundle) | 71% | Healthy |
Layer 3 — Company-level financial.
| Metric | Value | Healthy? |
|---|---|---|
| ARR | $10M | — |
| Bookings | $14M | — (40% above ARR; sign of healthy growth) |
| NRR | 128% | Strong (target > 110%) |
| GRR | 92% | Healthy (target > 90%) |
| Gross margin | 65% | Healthy AI-native (target 60–70%) |
| Compute as % of revenue | 25% | Healthy (target < 30% at this stage) |
| Cash runway | 120 months at current burn | — (will reset on Series B) |
| Pilot-to-production conversion | N/A | (PLG-led, not enterprise pilots) |
| Cohort gross margin trend | +3 points/quarter | Strong (model-cost decay contributing 2 points; usage expansion 1 point) |
| Compute concentration | 75% with one provider | Risk; multi-provider strategy needed |
Layer 4 — Capital efficiency & investor metrics.
| Metric | Value | Healthy? |
|---|---|---|
| Burn Multiple ($2.5M burn / $3.5M new ARR) | 0.7x | Excellent (target < 2.0x for AI-native) |
| Magic Number ($3.5M new ARR / $3.5M S&M last year) | 1.0 | Healthy |
| ARR per employee ($10M / 50) | $200K | Acceptable for AI-native at this scale |
| Gross profit per employee | $130K | Acceptable |
| R&D as % of revenue | 40% | High but appropriate at this stage |
| S&M as % of new ARR | 100% | Healthy |
| G&A as % of revenue | 20% | High; review for premature G&A build-out |
| Rule of 40 (40% growth + (-30%) EBITDA) | 10% | Below target; growth and margin both need improvement |
| Capital efficiency ratio ($10M ARR / $30M raised) | 0.33x | Below target (1.5x); typical for early-stage |
What this dashboard tells the team.
AgentCo is a healthy mid-stage AI-native company with strong unit economics, a working pricing architecture, and a clean operational story to tell investors. The Burn Multiple of 0.7x and LTV/CAC of 10x are genuinely strong, indicating the customer acquisition machine is producing efficient growth. NRR of 128% means the existing customer base is expanding; gross margin of 65% with 25% compute is at the right place for the stage.
The areas that need attention are visible: G&A at 20% suggests the team has built more overhead than the company yet supports (likely a controller plus full FP&A function before $25M ARR is premature). Compute concentration at 75% with one provider is a vendor risk that should be mitigated before Series B diligence. The Rule of 40 at 10% — driven by the operating loss — is the metric that will most likely drive Series B valuation conversations; the team should plan how to either accelerate growth or compress operating losses to improve this number to 25%+ before the raise.
The Layer 1 operational metrics (outcome rate 78%, cost per outcome $0.42 with 28% YoY decay) are the leading indicators that the financial trajectory is sustainable. If the outcome rate were falling or cost-per-outcome were flat, the financial metrics above would be late indicators of an underlying operational problem; here the operational metrics confirm the financial story.
A founder reading this dashboard sees a company that is fundamentally healthy but needs three specific things in the next 12 months: G&A discipline (no new finance hires until $20M ARR), compute concentration mitigation (multi-provider integration as engineering project), and Rule of 40 improvement (either growth acceleration or operating-loss compression). These are the action items the dashboard surfaces; without the comprehensive view, the team would optimize the wrong things.
F. AI Worker reference and benchmarks
Section E gives you the framework — the four-layer hierarchy, the architecture-specific KPIs, the stage priorities, the worked dashboard. Section F is the reference layer beneath it: specific KPI cards for each AI Worker type, consolidated benchmarks for at-a-glance comparison, diagnostic playbooks for interpreting deviations, dashboard templates for different stages and architectures, and a deep-dive on compute economics. This section is structured for navigation rather than linear reading — you reach for the specific card or table when you need it.
Per-worker-type KPI cards
The framework metrics in Section E apply across worker types. The actual benchmarks, pricing, and unit economics differ meaningfully by what the AI Worker does. Twelve cards below cover the most common AI Worker categories in 2026, each with operational KPIs, financial KPIs, and worked unit economics. Use these as starting templates; refine for your specific deployment.
Note on confidence for the cards below. Most of the operational ranges (acceptance rates, accuracy thresholds, latency targets) sit between [Industry benchmark] and [Emerging pattern] — they reflect well-observed practitioner consensus across published vendor data and research. Most of the financial ranges (revenue per outcome, cost per outcome, contribution margin, LTV/CAC) are [Author thesis] — they are informed extrapolations from observed deployments and vendor disclosures, sensitive to model choice, prompt efficiency, and customer mix. Use the ranges as starting reference points; validate against your own data before making material decisions on them.
1. Customer Support AI Worker
Use cases. Inbound support ticket triage, automated response generation, deflection of common queries, escalation routing.
Typical pricing. Per-Outcome (per resolved ticket) or Hybrid (subscription + per-ticket overage).
Operational KPIs. Resolution rate (resolved without escalation): 60–85%. CSAT post-resolution: 4.0–4.5/5. Mean time to resolution: 30 seconds–5 minutes (vs. human 15–60 min). False-resolution rate (recurring tickets): below 5%. Escalation accuracy (correctly escalates to right human): above 90%. Hallucination rate on factual responses: below 1%.
Financial KPIs. Revenue per resolved ticket: $0.50–3.00. Cost per resolved ticket: $0.20–0.80. Contribution margin per ticket: 50–75%. LTV/CAC: 5–15x mid-market, 10–25x enterprise. NRR: 110–140% (volume expansion as customers ramp confidence).
Worked unit economics. Customer pays $1.50 per resolved ticket. Compute cost: $0.45 per resolution. Allocated overhead: $0.15. Contribution margin: ($1.50 − $0.60) / $1.50 = 60%. A customer with 50K monthly tickets generates $75K/month revenue and $45K/month gross profit.
2. Sales Outreach AI Worker (SDR)
Use cases. Outbound prospecting, personalized email drafting, follow-up sequencing, meeting booking, CRM data enrichment.
Typical pricing. Per-Outcome (per booked meeting) or Per-Seat with usage caps.
Operational KPIs. Reply rate (positive responses): 2–8%. Meeting-booked rate (replies → meetings): 10–25%. Personalization accuracy (AI-generated personalization rated correct): above 80%. Sequence completion rate: 75–90%. Bounce rate: below 5%. Compliance violation rate (CAN-SPAM, GDPR): must be 0%.
Financial KPIs. Revenue per booked meeting: $50–300. Cost per booked meeting: $5–50. Meetings → opportunities conversion: 30–60%. Opportunities → closed deals: 15–35%. LTV/CAC for the AI tool itself: 8–20x. CAC payback period: 8–14 months.
Worked unit economics. Customer pays $200 per booked meeting. Compute cost (research + drafting + follow-up): $25 per booked meeting. Customer success allocation: $15. Contribution margin: ($200 − $40) / $200 = 80%. A customer booking 100 meetings/month generates $20K revenue and $16K gross profit.
3. Code Generation AI Worker
Use cases. In-IDE code completion, full function generation, refactoring, test generation, code review.
Typical pricing. Per-Seat (developer subscription) with usage caps, or Hybrid (subscription + token overages).
Operational KPIs. Acceptance rate (code accepted by developer): 25–45%. Pass rate (code passes tests on first try): 60–80%. Time saved per accepted suggestion: 30 seconds–5 minutes. Hallucination rate (fabricated APIs/functions): below 2%. Latency to first token: below 200ms. Edit distance (developer modifications to AI output): below 30% of lines.
Financial KPIs. Revenue per developer seat: $20–100/month. Compute cost per seat: $5–30/month. Gross margin per seat: 65–80%. Active developer rate: 70–90% of paid seats. NRR: 110–125% (seat expansion within accounts). LTV/CAC: 4–10x.
Worked unit economics. $40/month per seat. Compute cost: $12/month per active seat. Allocated infra: $3. Contribution margin: ($40 − $15) / $40 = 62.5%. A 1,000-developer customer generates $40K MRR and $25K gross profit MRR.
4. Document Analysis AI Worker
Use cases. Contract review, invoice processing, due-diligence document scanning, regulatory filing analysis.
Typical pricing. Per-Outcome (per processed document) or Per-Outcome with quality tiers (premium for human-validated output).
Operational KPIs. Processing accuracy (audit-sample correctness): 92–98%. Throughput: 100–10,000 documents/hour vs. human 5–50/hr. Confidence calibration (predicted accuracy matches actual): r² above 0.85. Hallucination rate on extracted facts: below 1%. Review-flag rate (documents flagged for human review): 5–20%. Cost per processed page: $0.05–0.50.
Financial KPIs. Revenue per processed document: $1–25. Cost per processed document: $0.20–5. Contribution margin per document: 60–80%. Customer concentration: typically high (regulated industries cluster). NRR: 115–135% (volume expansion).
Worked unit economics. Customer pays $5 per processed contract. AI compute + supporting cost: $1.20. Allocated overhead: $0.30. Contribution margin: ($5 − $1.50) / $5 = 70%. A 50,000-document/month customer generates $250K revenue and $175K gross profit.
5. Voice Agent
Use cases. Inbound call handling, outbound voice campaigns, appointment setting, voice-based customer service.
Typical pricing. Per-minute or per-call, sometimes Per-Outcome (per resolved call).
Operational KPIs. Containment rate (call resolved without human transfer): 30–70%. Conversation quality score (human rating): 4.0–4.5/5. Average call duration: 1–5 minutes (longer indicates inefficiency or complex issue). Latency to first response: below 800ms. Speech recognition accuracy: above 95%. Customer hang-up rate (frustration indicator): below 8%.
Financial KPIs. Revenue per minute or per call: $0.25–2.50/minute or $1–15/call. Cost per minute (ASR + LLM + TTS): $0.10–0.40. Gross margin per call: 50–70% (lower than text due to voice infrastructure). Concurrent call capacity: capacity-planning metric. LTV/CAC: 5–15x.
Worked unit economics. $1.50/minute. Compute cost: $0.55/minute. Voice infrastructure: $0.10. Contribution margin: ($1.50 − $0.65) / $1.50 = 57%. A 10,000-minutes/month customer generates $15K revenue and $8.5K gross profit.
6. Search & Retrieval AI Worker
Use cases. Enterprise search, semantic Q&A over knowledge bases, RAG-powered assistants, document discovery.
Typical pricing. Per-Seat (knowledge worker subscription) or Per-Query for high-volume use cases.
Operational KPIs. Retrieval precision (relevant docs in top 5): 70–90%. Answer accuracy (vs. ground truth): 75–90%. Query latency (p95): below 3 seconds. Citation accuracy (cited source actually supports the claim): above 90%. User satisfaction (thumbs up rate): 70–85%. Appropriate refusal rate (when AI says "I don't know"): 5–15%.
Financial KPIs. Revenue per seat: $30–150/month. Compute cost per seat: $8–40/month. Gross margin per seat: 60–75%. Index/storage cost per customer: $200–2,000/month depending on data volume. NRR: 105–125%.
Worked unit economics. $80/month per seat. Compute (queries + index): $25. Storage: $5. Contribution margin: ($80 − $30) / $80 = 62.5%. A 500-seat customer generates $40K MRR and $25K gross profit MRR.
7. Claims Processing AI Worker
Use cases. Insurance claims adjudication, healthcare prior authorization, expense report processing.
Typical pricing. Per-Outcome (per processed claim) or Value-Based (% of recovered/avoided costs).
Operational KPIs. Auto-adjudication rate (claims processed without human review): 40–75%. Decision accuracy (vs. expert audit): above 96%. Time to decision: 30 seconds–5 minutes (vs. human 15–60 min). Appeal/reversal rate: below 5%. Compliance violation rate: must be 0%. False-approval rate (incorrect approvals): below 1%.
Financial KPIs. Revenue per processed claim: $5–50 (lower for simple, higher for complex). Cost per processed claim: $1–10. Contribution margin per claim: 65–85%. Volume-driven NRR: 120–150% as customers scale processing. Sales cycle length: 6–18 months (regulated industry).
Worked unit economics. $12 per processed claim. AI cost: $2.50. Compliance/audit infrastructure: $0.80. Contribution margin: ($12 − $3.30) / $12 = 72.5%. A 100K-claims/month customer generates $1.2M revenue and $870K gross profit.
8. Meeting Summarization AI Worker
Use cases. Automatic meeting notes, action-item extraction, decision documentation, CRM update automation.
Typical pricing. Per-Seat (subscription) often included as feature in larger product.
Operational KPIs. Coverage (% of decisions/action items captured): 80–95%. Accuracy (% of captured items correctly attributed): 90–98%. Hallucination rate (fabricated decisions/actions): below 2%. Speaker attribution accuracy: above 85%. Processing time (relative to meeting duration): 0.1–1× (faster than real-time). User edit rate (% of summaries requiring edits): below 30%.
Financial KPIs. Revenue per seat: $10–40/month (often bundled feature). Compute cost per seat: $3–15/month. Gross margin per seat: 65–80%. Activation rate (seats with monthly use): 60–80%. Standalone vs. bundled revenue split: track separately.
Worked unit economics. $20/month per seat (if standalone). Compute: $7. Allocated overhead: $1.50. Contribution margin: ($20 − $8.50) / $20 = 57.5%. A 2,000-seat customer generates $40K MRR and $23K gross profit MRR.
9. Marketing Content AI Worker
Use cases. Blog post generation, ad creative variants, email campaigns, social media content, SEO content optimization.
Typical pricing. Per-Seat or Per-Generated-Output (per piece of content).
Operational KPIs. Acceptance rate (content used as-generated or with minor edits): 30–60%. Content quality score (human-rated): 3.5–4.5/5. SEO performance (rankings achieved): use-case specific. Brand-voice consistency: above 85% rated on-brand. Throughput: 10–500 pieces of content per hour. Originality score: above 90%.
Financial KPIs. Revenue per seat: $50–500/month. Compute cost per seat: $15–100/month (varies dramatically by content volume). Gross margin per seat: 60–75%. Customer churn (heavy in this category): 8–15% monthly for SMB. LTV/CAC: 3–8x (lower due to higher churn).
Worked unit economics. $200/month per seat. Compute (~500 pieces/month): $60. Infrastructure: $10. Contribution margin: ($200 − $70) / $200 = 65%. A 100-seat agency customer generates $20K MRR and $13K gross profit MRR.
10. Legal Research AI Worker
Use cases. Case-law research, contract analysis, regulatory compliance checking, legal drafting.
Typical pricing. Per-Seat (attorney subscription) — premium pricing.
Operational KPIs. Citation accuracy (cited cases actually exist and support the argument): above 95%. Hallucination rate (fabricated cases or citations): MUST be below 0.5%. Research completeness (coverage of relevant precedent): 80–95%. Time saved per research task: 30 minutes–4 hours. Confidence calibration: must be conservative (over-estimate uncertainty). Domain-specific accuracy: varies by practice area.
Financial KPIs. Revenue per attorney seat: $200–2,000/month (premium pricing). Compute cost per seat: $50–300/month. Gross margin per seat: 70–85%. Customer concentration: typically high (large law firms). NRR: 105–120%.
Worked unit economics. $800/month per attorney seat. Compute: $180. Index/data: $40. Contribution margin: ($800 − $220) / $800 = 72.5%. A 200-attorney firm generates $160K MRR and $116K gross profit MRR.
11. Recruiting AI Worker
Use cases. Candidate sourcing, resume screening, outreach automation, interview scheduling, candidate engagement.
Typical pricing. Per-Seat (recruiter subscription) or Per-Hire (outcome-based).
Operational KPIs. Sourcing precision (candidates matching criteria): 60–80%. Outreach reply rate: 15–35% (higher than sales because candidates care). Interview-to-hire conversion: 15–35%. Bias mitigation score: must be tracked and reported. Throughput: 50–500 sourced candidates per recruiter per week. Diversity outcomes: must be tracked and reported.
Financial KPIs. Revenue per seat: $200–1,500/month. Per-hire pricing alternative: 5–25% of first-year salary. Gross margin: 60–75%. Time-to-fill metric (operational, drives customer success): below 30 days. Customer concentration: typically diversified.
Worked unit economics. $600/month per recruiter seat. Compute + data: $130. Contribution margin: ($600 − $130) / $600 = 78%. A 50-seat HR-tech customer generates $30K MRR and $23K gross profit MRR.
12. Financial Analysis AI Worker
Use cases. Earnings analysis, portfolio research, financial modeling, M&A analysis, equity research.
Typical pricing. Per-Seat (analyst subscription) — high-value, premium pricing.
Operational KPIs. Calculation accuracy: must be above 99%. Source citation accuracy: above 95%. Hallucination rate on financial data: must be below 0.5%. Confidence intervals on predictive outputs: must be calibrated. Latency for complex analysis: below 60 seconds. Domain coverage (asset classes, geographies): use-case specific.
Financial KPIs. Revenue per analyst seat: $500–5,000/month (high-value analysts). Compute cost per seat: $100–500/month. Gross margin per seat: 75–88%. Customer concentration: very high (concentrated in financial services). NRR: 110–130%.
Worked unit economics. $2,000/month per seat. Compute: $300. Data feeds: $200. Contribution margin: ($2,000 − $500) / $2,000 = 75%. A 50-analyst hedge fund generates $100K MRR and $75K gross profit MRR.
Consolidated benchmarks table
A single reference table of healthy ranges for the most-tracked AI-native metrics, by stage. Use as a sanity check against your own numbers. NM = "not yet meaningful at this stage."
Note on confidence for the table below. The SaaS-derived metrics (LTV/CAC, CAC payback, NRR, GRR, Burn Multiple, Magic Number, Rule of 40) sit at [Industry benchmark] — broadly cited across SaaS finance literature⁴ and well-validated for subscription businesses. The AI-native-specific metrics (compute as % of revenue, AI Worker cost-per-outcome decay, pilot-to-production conversion, cohort gross margin trend, compute concentration) sit at [Emerging pattern] — observed across multiple AI-native companies in 2024–2026 but still evolving. The stage-specific calibration of all targets (which range applies at which stage) sits at [Author thesis].
| Metric | Layer | Pre-revenue (Seed) | Early ($1–5M ARR) | Mid ($5–25M ARR) | Scaling ($25M+ ARR) |
|---|---|---|---|---|---|
| ARR | 3 | <$1M | $1–5M | $5–25M | $25M+ |
| ARR growth (YoY) | 3 | NM | 200%+ | 100–200% | 50–120% |
| Gross margin | 3 | NM | 50–70% | 60–75% | 65–78% |
| Compute as % of revenue | 3 | NM | 25–50% | 20–35% | 15–30% |
| NRR | 3 | NM | 105–125% | 115–135% | 120–140% |
| GRR | 3 | NM | 85–95% | 90–95% | 92–96% |
| CAC payback period | 2 | NM | <24 months | <18 months | <14 months |
| LTV/CAC | 2 | NM | 3–8× | 5–12× | 5–15× |
| Burn Multiple | 4 | NM | <2.5× | <2.0× | <1.5× |
| Magic Number | 4 | NM | 0.5–1.0 | 0.8–1.5 | 0.7–1.2 |
| ARR per employee | 4 | NM | $100–200K | $150–300K | $200–400K |
| R&D as % of revenue | 4 | NM | 50–70% | 35–55% | 25–40% |
| S&M as % of new ARR | 4 | NM | 100–150% | 80–120% | 70–100% |
| G&A as % of revenue | 4 | NM | 15–25% | 10–18% | 8–14% |
| Rule of 40 | 4 | NM | aspirational | 20–30% | 30%+ |
| Capital efficiency ratio | 4 | NM | 0.2–0.5× | 0.5–1.2× | 1.0–2.0× |
| Cash runway | 3 | 18–24 months | 18–24 months | 18–24 months | 18–24 months |
| Compute concentration (top provider) | 3 | NM | <90% | <80% | <70% |
| Pilot-to-production conversion | 3 | NM | 40–60% | 55–70% | 65–80% |
| Cohort gross margin trend (YoY) | 3 | NM | flat to +5pts | +3 to +8pts | +3 to +6pts |
| Bookings/recognized revenue ratio | 3 | NM | 1.0–1.5× | 1.0–1.4× | 1.0–1.3× |
| Outcome attribution accuracy (if outcome-priced) | 1 | NM | >90% | >95% | >97% |
| AI Worker cost-per-outcome decay (YoY) | 1 | NM | 20–40% | 20–40% | 15–35% |
A score of "below the lower bound" or "above the upper bound" is not automatically bad — but it is the signal that something specific needs explanation. Companies whose metrics consistently sit outside the ranges either have something distinctive (good or bad) about their business or have measurement problems. The next subsection below — diagnostic playbooks — gives the standard set of investigations to run when a metric deviates.
Diagnostic playbooks
When a metric is off, the question is what to investigate first. The patterns below cover the ten most common metric deviations and the standard investigation sequence for each. Each entry follows the same structure: the symptom, the most likely causes, and the first three investigation steps.
Burn Multiple > 2.5× and rising. Likely causes: (1) S&M efficiency declining (CAC rising or NRR falling); (2) gross margin compression eroding contribution per customer; (3) opex growing faster than revenue. Investigation steps: run cohort analysis by acquisition month to identify whether new cohorts are weaker than older ones; decompose Burn Multiple into S&M-efficiency and non-S&M-burn components; review headcount additions in last 6 months against revenue contribution.
NRR below 100%. Likely causes: (1) downsell pressure from existing customers; (2) churn within renewal cohorts; (3) pricing decisions reducing per-customer revenue. Investigation steps: separate gross retention from expansion to find the source; review churn cohort to identify common attributes; review pricing changes in last 12 months for unintended consequences.
Gross margin declining quarter-over-quarter. Likely causes: (1) compute costs growing faster than revenue; (2) heavy users disproportionately growing share; (3) discount discipline lapsing in sales process. Investigation steps: compute-cost-per-active-customer trend by cohort; price-realization analysis (list price vs. realized price); compute-cost-per-outcome trend by AI Worker.
CAC payback above 18 months at $5M+ ARR. Likely causes: (1) S&M spend exceeding LTV potential; (2) targeting wrong customer segment; (3) sales cycle lengthening. Investigation steps: per-segment unit economics decomposition; sales-cycle trend analysis (median cycle length last 8 quarters); win-rate analysis by segment and channel.
High Layer 1 outcome rate but low Layer 3 gross margin. Likely causes: (1) underpricing relative to value delivered; (2) compute costs too high per outcome; (3) overhead allocation absorbing margin. Investigation steps: per-outcome unit economics decomposition (revenue, compute, supporting costs); benchmark per-outcome pricing against comparable workers; review what's in COGS vs. opex (misclassification risk).
Bookings significantly higher than recognized revenue. Likely causes: (1) outcome-based contracts dominating bookings; (2) variable-consideration constraints under ASC 606 limiting recognition; (3) implementation timing creating recognition lag. Investigation steps: revenue recognition policy review with auditor; deferred revenue waterfall analysis; outcome attribution telemetry validation.
Cost-per-outcome flat or rising over 12 months. Likely causes: (1) workflow drift (the AI is being asked to do harder things); (2) caching not working as designed; (3) prompt regression (newer prompts less efficient than older ones); (4) model upgrades not fully deployed. Investigation steps: per-customer cost-per-outcome to isolate which customers drive the trend; cache hit-rate analysis; prompt-token-efficiency comparison versus 12 months ago.
Customer concentration above 30% in top 5. Likely causes: (1) market segment too narrow; (2) sales targeting too specific; (3) over-investment in one anchor customer. Risk mitigation: diversification roadmap; churn-protection programs for top 5; pipeline analysis of mid-market and enterprise mix.
Compute concentration above 80% with one foundation-model provider. Likely causes: (1) single-vendor selection in early product days that never got revisited; (2) integration cost discouraged multi-provider work; (3) commercial relationship favored single vendor. Investigation steps: assess price-change exposure (what would 30% provider price increase do to gross margin?); outage-exposure assessment (last 12-month provider uptime, RTO); multi-provider integration cost estimate.
R&D above 60% of revenue past Series A. Likely causes: (1) over-investment relative to stage; (2) productivity issues in engineering; (3) building toward future revenue not yet realized. Investigation steps: engineering output metrics (features shipped, bugs resolved, AI Worker capability improvements); per-engineer revenue contribution (if assignable); capital-allocation framework review.
The diagnostic playbook does not give you the answer — it gives you the investigation. The actual answer comes from looking at your specific data with the right questions in mind. Mature finance functions maintain a "diagnostic library" of past investigations that helps the team recognize repeat patterns faster.
Cohort dashboard template
Cohort analysis with model-cost decay (Approach 8) is the single highest-leverage analytical tool an AI-native finance function maintains. Below is a template for the cohort view that surfaces the dynamics traditional SaaS cohort analysis misses. Adapt the columns to your business; the structure is what matters.
Standard cohort dashboard structure:
| Cohort (acquisition Q) | Customers acquired | Q+0 | Q+1 | Q+2 | Q+3 | Q+4 | Q+5 | Q+6 | Q+7 | Q+8 |
|---|---|---|---|---|---|---|---|---|---|---|
| Q1 2024 | 25 | 100% | 96% | 92% | 88% | 88% | 88% | 88% | 84% | 84% |
| Q2 2024 | 30 | 100% | 97% | 93% | 90% | 90% | 90% | 87% | 87% | — |
| Q3 2024 | 32 | 100% | 97% | 91% | 91% | 88% | 88% | 88% | — | — |
| Q4 2024 | 35 | 100% | 94% | 91% | 91% | 89% | 86% | — | — | — |
This is the standard logo-retention cohort view. SaaS finance teams have produced this for two decades. AI-native finance adds two more views.
Revenue retention by cohort:
| Cohort | Q+0 | Q+4 (1 year) | Q+8 (2 years) | NRR Q+8 |
|---|---|---|---|---|
| Q1 2024 | $100K | $115K | $128K | 128% |
| Q2 2024 | $125K | $138K | $145K | 116% |
| Q3 2024 | $135K | $150K | — | — |
| Q4 2024 | $145K | $158K | — | — |
Gross margin by cohort (with model-cost decay decomposition):
| Cohort | Gross margin Q+0 | Gross margin today | Total improvement | Behavior contribution | Model-cost-decay contribution |
|---|---|---|---|---|---|
| Q1 2024 | 55% | 72% | +17 pts | +6 pts (usage growth, product expansion) | +11 pts (foundation-model price decay) |
| Q2 2024 | 58% | 72% | +14 pts | +5 pts | +9 pts |
| Q3 2024 | 60% | 71% | +11 pts | +4 pts | +7 pts |
| Q4 2024 | 62% | 71% | +9 pts | +3 pts | +6 pts |
The decomposition is the part that takes work. The "behavior contribution" requires holding compute prices constant at acquisition-period levels (the synthetic-cost baseline) and measuring margin change from customer behavior alone. The "model-cost-decay contribution" is the residual — the margin improvement attributable to falling foundation-model prices.
The decomposition reveals the strategic truth. A naive reader of the cohort margin trend sees a company whose pricing power is improving fast (margins up 17 points!). The decomposition shows that pricing power has improved modestly (6 points from behavior) and that the bigger driver is the structural margin tailwind from compute price decay (11 points). Strategic decisions made on the naive view (assuming pricing power that doesn't exist) are different from decisions made on the decomposed view (recognizing that the tailwind will eventually slow as compute prices stabilize).
The same template can be extended to per-customer-segment cohorts, per-AI-Worker-type cohorts, or per-pricing-architecture cohorts. The discipline is consistent; the decomposition is the value.
Stage-specific investor diligence checklists
Different fundraising stages have different metric expectations. The lists below cover what investors actually ask for at each stage; preparing the materials in advance compresses the diligence timeline meaningfully.
Series A diligence (typical raise: $5–25M).
Investors expect:
- Last 12 months of monthly revenue (MRR/ARR) with subscription/usage/outcome breakdown
- Customer count by month, with new/churned/active flow
- Cohort retention chart (logo and revenue) for the last 4–8 cohorts
- Cohort gross margin with explicit compute breakdown
- Top 10 customers with ACV, contract length, and renewal status
- CAC by acquisition channel, blended CAC, and CAC payback period
- Burn rate trajectory by month (last 12 months)
- Capital efficiency since founding (total raised vs. current ARR)
- Forward 18-month forecast with explicit assumptions (revenue model, growth rate, hiring plan)
- Compute cost as % of revenue, with provider breakdown
- Founder team and current org chart
The Series A bar in 2026 is roughly: $1–3M ARR, 200%+ growth, healthy unit economics on the dominant cohort, gross margin above 50%, early NRR above 110%.
Series B diligence (typical raise: $25–75M).
Series A diligence plus:
- Full cohort gross margin trends with model-cost-decay decomposition
- Pilot-to-production conversion rates (if enterprise sales motion)
- Per-segment unit economics (SMB / mid-market / enterprise)
- Compute concentration analysis with multi-provider strategy
- Revenue recognition policy with auditor sign-off documentation
- ASC 606 audit trail for usage and outcome contracts
- Capital allocation framework (compute / people / customer acquisition)
- Engineering output metrics (features shipped, AI Worker capability improvements)
- Burn Multiple, Magic Number, and Rule of 40 trajectory
- Forward 24-month forecast with sensitivity analysis on compute price decay
- Detailed customer reference checks (investors will call top customers)
- Outcome attribution accuracy (if outcome-priced)
The Series B bar in 2026 is roughly: $5–15M ARR, 100%+ growth, Burn Multiple under 2x, NRR above 120%, gross margin above 60%, demonstrated cohort retention through the second renewal.
M&A diligence (strategic acquisition or PE).
Series B diligence plus:
- Audited financials for the last 2–3 years
- Quality of earnings deep-dive (typically by a Big Four accounting firm)
- Forecast accuracy track record (last 8 quarters of forecast vs. actuals)
- Detailed contract review (customer contracts, vendor contracts, employment agreements)
- Technology and IP assessment (model ownership, foundation-model dependencies, training data provenance)
- Compliance and regulatory review (data privacy, sector-specific regulations)
- Customer concentration risk with detailed contractual terms
- Compute concentration risk with foundation-model provider contracts
- Outcome attribution audit (sample-based verification of attribution accuracy)
- Tax structure review (transfer pricing, deferred revenue treatment, R&D credits)
- Working capital analysis (DSO, prepaid compute, deferred revenue waterfall)
The M&A bar varies by acquirer thesis. Strategic acquirers care most about technology and customer fit; PE acquirers care most about cash flow and predictability; financial sponsors care most about exit pathways.
A sophisticated finance function maintains running data rooms — folders that contain everything needed for each diligence stage, updated quarterly so that "we can be ready in 30 days" is true rather than aspirational.
Compute economics deep-dive
Compute is the single largest variable cost for most AI-native companies. Understanding its economics in detail — not just at the gross-margin-percentage level but at the per-unit, per-modality, and per-provider level — is what separates surface-level AI finance from operational AI finance.
Per-modality cost ranges (2026). Foundation-model and infrastructure pricing varies by modality. The ranges below are typical rather than precise [Author thesis: based on snapshot of 2026 published pricing across major providers; specific provider pricing changes frequently and should be verified before any forecast model]; specific provider pricing changes frequently and should be verified before any forecast model.
| Modality | Typical cost range | Cost driver |
|---|---|---|
| Text generation (LLM API) | $0.50–15 per 1M input tokens; $1.50–75 per 1M output tokens | Model size and quality tier |
| Voice synthesis (TTS) | $0.05–0.30 per minute of generated speech | Voice quality and naturalness |
| Voice recognition (ASR/STT) | $0.02–0.20 per minute transcribed | Real-time vs. batch, language, accuracy tier |
| Image generation | $0.005–0.10 per image | Resolution, model quality |
| Video generation | $0.10–2.00 per second of generated video | Resolution, length, model quality |
| Embeddings | $0.02–0.30 per 1M tokens | Embedding dimensionality and quality |
| Fine-tuning | $50–500 per 1M tokens of training data + host compute | Model size, training method |
The wide ranges within each modality reflect tiered pricing — high-quality models cost 5–50× more than basic models. Companies that match model tier to use case (using basic models where adequate, premium models only where required) capture meaningful margin advantage over companies that default to premium for everything.
Provider pricing comparison framework. Three categories of compute provider in 2026, with different pricing dynamics:
Foundation-model API providers. Anthropic, OpenAI, Google, Mistral, Cohere, Together AI, Fireworks. Variable cost, no upfront commitment, prices fall 30–60% per year. Easiest path; least margin control; vendor concentration risk if dependent on one provider.
Hyperscaler offerings. AWS Bedrock (Claude, Llama, others), Azure OpenAI, GCP Vertex AI. Generally similar API pricing to direct foundation-model providers, with two added benefits — purchasing through existing cloud-vendor relationships (compliance, single PO, committed-spend discounts) and regional residency options for regulated industries. Slightly higher per-unit cost than direct API in most cases, offset by procurement and compliance benefits.
Self-hosted / open-weight models. Llama, Mistral, Qwen, DeepSeek, and the broader open-weight ecosystem deployed on owned or rented GPUs. Fixed cost (GPU rental or purchase) regardless of utilization; requires utilization above breakeven to compete economically with API pricing. Typical breakeven varies by workload, but rough heuristic: self-hosting is competitive at sustained 50–70% GPU utilization for medium-traffic workloads, less competitive below 30% utilization or for spiky workloads.
Build-vs-buy economics for compute. The decision to self-host vs. use foundation-model APIs is fundamentally a utilization-and-volume question. The math:
API cost per inference = $X (variable, scales linearly)
Self-host cost per inference = (GPU hourly cost / inferences per hour at target latency) + amortized engineering cost
A typical H100 GPU costs roughly $2–4 per hour rented and delivers 50–500 inferences per second depending on model size, quantization, batching, and latency requirements. At 100 inferences per second sustained (360,000 inferences per hour), self-hosted cost per inference at $3/GPU-hour is roughly $0.0000083 per inference plus engineering overhead. Compare that to API costs that might be $0.005–0.05 per equivalent inference; self-hosting is dramatically cheaper at high utilization. At 10 inferences per second sustained (low utilization), self-hosted cost per inference rises to $0.000083 — still cheaper than API but with all the operational overhead and capacity-planning risk that self-hosting entails.
The decision in practice is rarely pure economics. Self-hosting requires engineering capability, capacity-planning discipline, and uptime accountability that small teams often cannot deliver. Most AI-native companies start on APIs (lower operational burden), evaluate self-hosting at $5–15M ARR scale (when compute is large enough that engineering optimization is worth it), and adopt hybrid strategies (self-host the highest-volume workloads, API for everything else) past $25M ARR.
Cost-per-modality benchmarking. What "good" looks like by modality varies. A well-optimized customer-support text agent at scale runs $0.20–0.40 per resolved ticket. A voice agent runs $0.30–0.70 per minute. An image generation use case runs $0.01–0.05 per image. These numbers should be tracked monthly; deviations from benchmark trigger investigation (model upgrade, prompt regression, batching opportunity, caching opportunity).
Operational health metrics for AI Workers
Beyond the six core operational KPIs in Section E, mature AI Worker monitoring includes a deeper layer of health metrics. These determine whether the AI Worker is operationally trustworthy in addition to operationally productive. Six metrics worth tracking:
Drift detection rate. The percentage of inputs that fall outside the distribution the AI Worker was designed for. Drift is normal — customer behavior changes, edge cases emerge — but rising drift is a leading indicator of accuracy degradation. Healthy: drift detected on 5–15% of inputs, with explicit handling (escalation, low-confidence flagging) on those inputs. Concerning: drift below 1% (suggesting drift detection isn't working) or above 30% (suggesting the AI Worker is operating well outside its design envelope).
Hallucination rate by domain. The frequency of fabricated facts in AI Worker outputs, segmented by topic domain. A general assistant might have a 2% hallucination rate overall but 8% in legal questions and 15% in medical questions. Tracking by domain reveals which use cases are unsafe to rely on; aggregate-only tracking masks the variance that determines real-world risk.
Latency distribution (p50, p95, p99). Mean latency hides the experience of the worst-served users. A p50 of 1 second with p99 of 30 seconds means 1% of users wait 30 seconds — typically too long for a positive experience. Health: p99 should be no more than 3–5× p50; if larger, capacity is misprovisioned or queueing is broken.
Prompt-injection resistance. The percentage of adversarial inputs (designed to manipulate the AI into breaking rules) that the AI Worker correctly refuses or contains. Critical for any AI Worker handling untrusted user input. Healthy: above 95% on standard adversarial-input test sets, regularly re-evaluated as attack patterns evolve.
Refusal rate appropriateness. The frequency with which the AI Worker correctly says "I don't know" or "I cannot help with this" versus inappropriately refusing reasonable requests or inappropriately attempting requests it should refuse. Two failure modes — over-refusal (declining things it should answer) and under-refusal (attempting things it shouldn't) — measured separately. Healthy ranges depend on use case but the calibration should be monitored.
Evaluation-set performance trend. Performance against a curated evaluation set, tracked over time. Models change (foundation-model upgrades, prompt iterations, new training data); the evaluation set is the constant ruler. Trending performance against the eval set is the canonical regression-detection mechanism. A declining trend signals regression; investigate before the regression shows up in customer-facing metrics.
These six metrics belong in the AI Worker monitoring stack alongside the six core KPIs from Section E. Together they give finance, product, and engineering a shared view of operational health — and an early-warning system for the financial impacts that will follow if operational health degrades.
Additional worked dashboards
The AgentCo dashboard in Section E covers a $10M-ARR mid-stage company on hybrid pricing. The dashboards below cover three additional stages and architectures.
Worked example: SeedAI at pre-revenue (Seed stage)
Profile. Pre-revenue AI agent company, 4 months out from public launch. 8 employees. $3M Seed raised 6 months ago. 5 design partners using the product in beta, no commercial contracts yet. Pricing model in development; expected to ship at Per-Call.
Layer 1 metrics.
| Metric | Value | Notes |
|---|---|---|
| Outcome rate (in beta) | 65% | Trending up; up from 45% three months ago |
| Quality score | 3.8/5 | Improving with prompt iteration |
| Cost per outcome (in beta) | $0.85 | High; will fall as model usage matures |
Layer 2 metrics. Not yet meaningful — no commercial relationships.
Layer 3 metrics.
| Metric | Value | Notes |
|---|---|---|
| Monthly burn | $200K | Includes 8 employees + compute + infrastructure |
| Cash on hand | $1.8M | After $1.2M deployed in 6 months |
| Cash runway | 9 months | Tight; need to raise within 6 months or hit revenue |
| Compute spend | $15K/month | Beta usage by 5 design partners |
Layer 4 metrics. Not yet meaningful at pre-revenue.
What this dashboard tells the team. SeedAI is pre-revenue with 9 months of cash; the only metrics that matter are runway, burn, and lead indicators (beta engagement, quality trending up, cost-per-outcome trending down). The quality score moving from low-3s to high-3s is the clearest health signal; if quality plateaus before public launch, the launch will fail. The team should focus exclusively on getting outcome rate and quality to ship-ready levels before fundraising and ignore everything else. A team at this stage producing a complex KPI dashboard is wasting energy; runway and quality trajectory are the only things that matter.
Worked example: ScaleAI at $50M ARR Series B (value-based pricing component)
Profile. Enterprise AI company, primarily ABM and field-sales motion. $50M ARR. 180 employees. Series B closed 12 months ago ($75M raised). Pricing is hybrid with substantial value-based engagements at strategic enterprise customers (5 customers on value-based contracts contributing $18M of $50M ARR; remaining $32M on Per-Outcome and Hybrid contracts).
Layer 1 metrics.
| Metric | Value | Healthy? |
|---|---|---|
| Outcome rate (across all customers) | 81% | Yes |
| Outcome attribution accuracy | 96% | Yes (target above 95%) |
| Cost per outcome | $0.31 | Yes; fell 30% YoY |
Layer 2 metrics.
| Metric | Value | Healthy? |
|---|---|---|
| ACV (subscription customers) | $250K | — |
| ACV (value-based customers) | $3.6M | Premium pricing |
| LTV/CAC (subscription) | 7× | Healthy |
| LTV/CAC (value-based) | 12× | Strong |
| CAC payback (blended) | 16 months | Healthy |
Layer 3 metrics.
| Metric | Value | Healthy? |
|---|---|---|
| ARR | $50M | — |
| Bookings | $68M | 36% above ARR (value-based contract growth) |
| NRR | 135% | Strong |
| Gross margin | 70% | Strong |
| Compute as % of revenue | 22% | Healthy |
| Pilot-to-production conversion | 71% | Strong |
| Variable consideration recognition rate | 60% | Mid-range; trending up as track record matures |
Layer 4 metrics.
| Metric | Value | Healthy? |
|---|---|---|
| Burn Multiple | 1.2× | Strong |
| ARR per employee | $278K | Strong for AI-native at this scale |
| Rule of 40 | 45% (60% growth + (-15%) EBITDA) | Strong |
| Capital efficiency ratio | 0.50× ($50M ARR / $100M raised) | Improving |
What this dashboard tells the team. ScaleAI is a healthy Series B AI-native company with strong unit economics and a working hybrid pricing strategy. The value-based contracts are doing their job — concentrating revenue with strategic accounts at premium pricing. The 60% variable-consideration-recognition rate is the metric to watch; as the value-based contracts age and the audit-defensible value calculation matures, this number should rise toward 75–85%, which would unlock another $5–10M of GAAP revenue from already-signed contracts. The team should focus on completing the audit cycles on year-1 value-based contracts to support revenue recognition, while continuing to build the value-based pipeline at strategic accounts.
Worked example: ScaleCo at $150M ARR Series C+ (mature scaling)
Profile. Late-stage AI-native company, primarily Per-Outcome pricing. $150M ARR. 450 employees. Series C closed 18 months ago ($150M raised). 800 customers across mid-market and enterprise. Preparing for Series D or strategic alternatives in next 12–18 months.
Layer 1 metrics. (Aggregated; full per-AI-Worker reporting available internally)
| Metric | Value | Healthy? |
|---|---|---|
| Outcome rate (across all AI Workers) | 84% | Strong |
| Cost per outcome trend (YoY) | -22% | Healthy |
| Outcome attribution accuracy | 98% | Excellent |
Layer 2 metrics.
| Metric | Value | Healthy? |
|---|---|---|
| ACV (blended) | $190K | — |
| LTV/CAC | 9× | Strong |
| CAC payback | 13 months | Strong |
| Contribution margin per outcome | 74% | Strong |
Layer 3 metrics.
| Metric | Value | Healthy? |
|---|---|---|
| ARR | $150M | — |
| Bookings | $185M | 23% above ARR |
| NRR | 138% | Excellent |
| GRR | 94% | Strong |
| Gross margin | 75% | Strong (top of AI-native range) |
| Compute as % of revenue | 18% | Excellent (down from 28% two years ago) |
| Cohort gross margin trend | +4 pts/year | Strong (model-cost decay slowing) |
Layer 4 metrics.
| Metric | Value | Healthy? |
|---|---|---|
| Burn Multiple | 0.4× | Excellent |
| ARR per employee | $333K | Strong |
| R&D as % of revenue | 28% | Mature SaaS-like |
| S&M as % of new ARR | 78% | Strong |
| Rule of 40 | 50% (40% growth + 10% EBITDA) | Strong |
| Capital efficiency ratio | 0.94× ($150M ARR / $160M raised) | Strong |
What this dashboard tells the team. ScaleCo is approaching IPO-readiness metrics. The Rule of 40 above 40%, Burn Multiple under 0.5×, and gross margin at 75% are all in the ranges public AI-native investors will want to see. Three areas warrant continued attention: (1) the cohort gross margin trend is decelerating from +6 pts/year two years ago to +4 pts/year now, suggesting model-cost decay is normalizing — the team should plan for continued margin growth from product-side levers (efficiency engineering, pricing power) rather than rely on the structural tailwind continuing; (2) R&D at 28% may compress further as the company scales — the team should plan for which capabilities to maintain in-house vs. through partnerships; (3) the company has the metrics to support either Series D at premium valuation or strategic alternatives (acquisition, IPO preparation) — the strategic question is which path produces the best risk-adjusted outcome for stakeholders.
The three dashboards together show how metric priorities shift across stages. SeedAI cares about runway and quality. ScaleAI cares about cohort behavior, value-based contract maturation, and Burn Multiple discipline. ScaleCo cares about Rule of 40, capital efficiency, and IPO-readiness benchmarks. The same framework applies to all three; the specific metrics that matter most differ by stage.
Cross-cutting concepts
The compute-as-COGS reality. Traditional SaaS thinks of hosting costs as a small footnote to the income statement. AI-native finance treats compute as a primary line — often the largest variable cost, sometimes 30–60% of revenue. This single difference cascades through every aspect of finance: gross margin definitions, pricing architectures, forecast complexity, capital allocation, investor reporting. A founder coming from traditional SaaS who treats compute as a hosting-equivalent line item will systematically misjudge their business.
Bookings vs. recognized revenue. In subscription SaaS, bookings (the contractual value of signed deals) and recognized revenue (the GAAP revenue on the P&L) closely track each other — recognized revenue is the bookings divided by the contract length, recognized monthly. In AI-native companies with usage- or outcome-based contracts, the two diverge meaningfully. A company can have $10M in signed bookings but only $4M in recognized revenue because the bulk of the contracts are outcome-based and revenue recognition is constrained until outcomes are delivered. Investors and boards must learn to read both numbers; presenting only one of them produces misleading pictures.
Model-cost decay as a margin tailwind. AI-native companies have a structural margin tailwind that traditional SaaS does not — foundation-model prices fall 30–60% per year, so the cost of serving customers acquired today will be lower in 2028 than it is now. This affects pricing decisions (room to lower prices over time), CAC payback acceptable thresholds (longer payback acceptable when the cohort gets more profitable over time), and capital allocation (margin tailwind competes with revenue growth as a margin driver). Companies that ignore this dynamic make worse decisions than companies that model it explicitly.
The pilot-to-production conversion gap. Enterprise AI deals are typically signed as paid pilots before production contracts. The conversion rate is meaningfully less than 100% — typical mature companies see 50–75%. Pilot revenue and production ARR have different economic characteristics; conflating them produces misleading financial pictures. The discipline of reporting them separately is straightforward but frequently neglected, particularly during fundraising when the temptation to inflate ARR is greatest.
Outcome attribution as an audit risk. Per-outcome pricing requires audit-grade telemetry to defend each billable event. Without it, customer disputes turn revenue collection into negotiation. Auditors examining outcome-based contracts increasingly request the attribution telemetry as part of revenue-recognition support. Companies running outcome-based contracts without disciplined attribution face audit comments at year-end and potential revenue restatements.
Compute concentration risk. AI-native companies frequently depend on one or two foundation-model providers for the bulk of their compute. A 90% concentration with Anthropic and OpenAI creates vendor risk that traditional SaaS does not face. Investors increasingly ask about concentration; sophisticated companies report it as a tracked metric and have multi-provider strategies even when they do not exercise them.
What AI changes about every finance discipline
Five changes recur across the approaches and deserve explicit naming.
1. Gross margin redefined. Traditional SaaS expected 75–85% gross margins; AI-native gross margins typically run 50–70%. The 15–25 percentage point gap is largely compute. Investors and acquirers benchmarking AI-native companies against traditional SaaS norms produce misleading conclusions; the appropriate comparison is "AI-native gross margin including compute" against "AI-native gross margin including compute," not against pure-software comparables.
2. Forecasting under continuous price decay. Traditional SaaS forecasts assume stable unit costs. AI-native forecasts must explicitly model compute price decay (typically 30–60% per year for major model providers). Without this layer, forecasts systematically understate out-quarter margins and produce misleading runway projections.
3. Revenue recognition complexity at smaller scales. Traditional SaaS revenue recognition is simple at any scale because the contract structure is uniform. AI-native companies hit revenue-recognition complexity (variable consideration, multiple performance obligations, outcome-dependent payments) at much smaller revenue scales than SaaS norms. A $5M ARR AI-native company often faces revenue-recognition questions that comparable-revenue SaaS companies do not face until $50M.
4. The pilot-to-production motion as standard. Traditional enterprise SaaS sells annual contracts directly. Enterprise AI sells pilots first, then production contracts. The two-stage commercial structure produces accounting complexity (how to recognize pilot revenue, how to forecast pilot conversion) that traditional SaaS does not face.
5. The new role: AI Finance Engineer. AI-native finance teams increasingly include a function not present in traditional SaaS — an engineer or data scientist who builds the data infrastructure for cohort analysis, compute attribution, outcome attribution, and forecast modeling. Parallel to the AI Outcome Engineer in the Sales Catalog, this role is what makes Tier 2 metrics in investor reporting possible. Companies without one are running AI-native finance with traditional SaaS tooling, which produces reporting that misses the AI-native dynamics.
Common hybrid models
Most AI-native companies do not run a single architecture; they run combinations that evolve as they scale. Five common hybrid evolution paths recur often enough to deserve naming.
Per-Call (2) → Per-Call + Subscription (5). Companies start with pure usage-based pricing (typical for AI infrastructure and developer-buyer products) and add a subscription floor as they scale, producing more predictable revenue and protecting against the bill-anxiety problem. The transition typically happens at $5–10M ARR, when investor pressure for predictability begins outweighing the architectural simplicity of pure usage.
Per-Seat (1) → Per-Seat + Usage Overage (5). Companies start with traditional Per-Seat SaaS (typical for AI-augmented productivity tools) and add usage overages as compute costs threaten margin on heavy users. The transition typically happens when the compute share of revenue exceeds 15%, signaling that pure Per-Seat is unsustainable.
Per-Seat (1) → Per-Outcome (3). A more dramatic evolution: companies that started with subscription pricing for an AI feature realize the AI is doing labor-replacement work and convert to outcome-based pricing for the AI-specific functionality, often retaining Per-Seat for the surrounding workflow. This typically requires a renegotiation of customer contracts and produces meaningful revenue uplift on customers where the AI is doing high-value work.
Pilot (Approach 9) → Production Contract. The standard enterprise AI commercial sequence: paid pilot → production contract. The accounting and reporting transition is the standard pattern for any company running an enterprise sales motion. Companies that do not formalize this evolution typically misforecast revenue.
Per-Call (2) → Per-Outcome (3) for specific workflows. Companies running Per-Call infrastructure pricing identify specific workflows where outcome-based pricing produces meaningfully more revenue (typically 3–10x higher revenue per call). They convert those workflows to outcome pricing while retaining Per-Call for the rest. This produces a hybrid pricing structure that captures more value where the AI is doing labor-replacement work.
These hybrids are not unique configurations. Most successful AI-native companies run a recognizable variant of one or more.
Common finance failures
Eight failure patterns appear often enough to deserve naming. A finance leader who recognizes these in their own operation can fix them; a leader who does not will keep losing the same way.
Compute-as-hosting misclassification. The team treats compute the way traditional SaaS treats hosting — a small footnote to the P&L — and fails to surface it as a primary cost line in investor reporting. Investors comparing the company to traditional SaaS norms produce misleading conclusions. The fix is to report compute as a distinct line item in COGS, with explicit calculation of compute-as-percentage-of-revenue every quarter.
ARR inflation through pilot inclusion. The team includes paid-pilot revenue in ARR figures during fundraising. Sophisticated investors discover the practice during diligence and lose trust. The fix is to report pilot revenue separately from ARR in all materials, with explicit conversion-rate disclosure.
Aggressive revenue recognition that auditors restate. The company recognizes revenue under optimistic assumptions about variable consideration in usage- or outcome-based contracts. Auditors disagree at year-end; revenue is restated downward; investors lose confidence. The fix is to engage AI-experienced revenue accountants before signing the first non-subscription contract, document the recognition policy formally, and review with auditors during the first audit cycle.
Compute commitment overcommitment. The team commits to large prepaid compute purchases for discount pricing, then customer growth comes in below forecast. The committed compute sits unused; the prepaid asset becomes a financial drag. The fix is to size compute commitments conservatively against demonstrated demand, not optimistic forecasts.
Cohort analysis without model-cost decay separation. The team tracks cohort retention and revenue but not gross margin trends with explicit model-cost-decay decomposition. The naive cohort margins look like they are improving from customer behavior; in reality the improvement is mostly compute-price decay. Strategic decisions are made on the wrong attribution. The fix is to build the synthetic-cost baseline and decompose margin trends explicitly.
Forecasting with constant compute prices. The team builds 12–24 month forecasts assuming compute costs remain at current percentage-of-revenue levels. The forecasts systematically understate out-quarter margins; runway projections are conservative; strategic options are missed. The fix is to add an explicit compute-price-decay layer to the forecast model with multiple scenarios.
Premature CFO hire. The team hires a CFO at $2M ARR, expecting the CFO to "professionalize finance." The CFO arrives, builds infrastructure for a $50M company, and burns capital that could have funded growth. The fix is to use a fractional CFO or experienced controller until the company reaches $10M+ ARR with complex contract structures; full CFO hires before that scale typically destroy more value than they create.
Investor reporting heavy on bookings, light on cash. The team reports impressive bookings figures and total contract value while underemphasizing cash runway and recognized revenue. Investors who anchor on cash flow and GAAP revenue produce different conclusions than the team's narrative suggests. The fix is to lead reporting with cash and recognized revenue; supplement with bookings as context.
AI-native finance anti-patterns
Five additional traps specific to AI-era finance.
Treating model spend as fixed infrastructure. The team negotiates a fixed-fee enterprise compute deal with a foundation-model provider, then uses that fixed cost for every customer regardless of actual usage. Customers who consume heavily get cross-subsidized by light users; the unit economics by customer become opaque. The fix is to attribute compute costs to specific customers and workflows even when the underlying contract is fixed-fee, using metering infrastructure that tracks per-customer consumption.
Ignoring compute concentration risk. The team depends on a single foundation-model provider for 90%+ of compute and treats it as a non-issue. The provider raises prices, has an outage, or modifies terms; the company has no fallback. The fix is to maintain multi-provider integrations even when they are not exercised in normal operations, monitor provider terms changes proactively, and report concentration risk in board materials.
Pricing based on cost rather than value. The team prices the product based on a markup over compute cost (cost-plus pricing) rather than the value the AI creates for the customer. The pricing leaves substantial revenue on the table — particularly for outcome-based and value-based architectures where the value is many times the cost. The fix is to anchor pricing to customer value (labor cost replaced, revenue generated, costs avoided) rather than to seller cost.
Forecasting without model-improvement scenarios. The team forecasts revenue assuming the current AI capability remains constant. Six months later, foundation models improve significantly, the company's product becomes more capable, and the forecast is meaningfully wrong in either direction (better products driving more usage, or competitive products commoditizing the offering). The fix is to include capability-improvement scenarios in the forecast — explicit modeling of what happens if foundation models get 2x more capable in the next 12 months.
Building Tier 2 metrics retroactively. The team waits until a Series B fundraise to build cohort analysis with model-cost decay, outcome-attribution accuracy tracking, and forecast-accuracy reporting. The data infrastructure does not exist; the metrics are estimated retroactively from imperfect historical data; investors detect the imprecision and lose confidence. The fix is to build the data infrastructure before the metrics are needed — the AI Finance Engineer role exists for this reason.
Minimum viable finance stack and stage recommendations
Most AI-native founders do not need a sophisticated finance function in the first 18 months. The minimum viable stack and stage-by-stage prescriptions are below.
Minimum viable finance stack (Pre-revenue through Early Traction).
The smallest set of finance practices that produces a defensible operation for an early-stage AI-native B2B company:
-
Stripe (or equivalent) for billing — start month 1. Handles subscription invoicing, usage metering, and payment collection. Cost: percentage of revenue collected. Most AI-native companies use Stripe; alternatives include Paddle, Chargebee, and emerging AI-native billing tools.
-
Pilot, Bench, or Puzzle for bookkeeping — start month 1. Monthly close, basic financial statements, tax preparation. Cost: $200–$1,500/month. Eliminates the need for an in-house bookkeeper until at least Series A.
-
Mercury or Brex for banking and treasury — start month 1. Modern banking infrastructure that integrates with bookkeeping tools. Cost: free or minimal at small scale.
-
Three numbers tracked weekly — start month 1. Revenue, gross margin, runway. Update from the bookkeeping tool. Display somewhere visible to the founder.
-
Quarterly forecast spreadsheet — start month 6. Simple 18-month projection of revenue and burn. Update at the start of each quarter; compare to actuals.
-
External auditor relationship — start at Series A diligence. Identify a CPA firm with AI-native experience for the first audit cycle. Most companies do not need a formal audit until Series B; an "audit equivalent" Quality of Earnings review is typical at Series A.
That is the entire minimum viable stack. Skip the rest until stage warrants.
Stage-based recommendations.
| Company stage | Primary finance practices | Avoid for now |
|---|---|---|
| Pre-revenue (Seed) | Stripe + Pilot/Bench/Puzzle, three numbers tracked weekly, simple runway forecast | CFO hire, FP&A software, formal audit, complex revenue recognition policies |
| Early revenue ($1M–$5M ARR) | Add controller (fractional or full-time), monthly board reporting basics, formal revenue recognition policy | CFO hire, custom FP&A platform, sophisticated cohort analysis |
| Scaling pre-Series B ($5M–$15M ARR) | Add VP Finance or senior controller, formal monthly close, basic cohort analysis, AI Finance Engineer role | CFO unless preparing for IPO trajectory, complex multi-entity structures |
| Post-Series B ($15M+ ARR) | CFO, full FP&A team, sophisticated cohort analysis with model-cost decay, audit-defensible outcome attribution | Premature IPO preparation infrastructure |
The most common founder mistake is hiring a CFO too early. The role's value scales with company complexity; a CFO at $3M ARR has too little to do and burns capital that could fund growth. The right sequence is: founder doing the books → fractional controller → full-time controller → VP Finance → CFO, with the transitions tied to revenue stage and complexity rather than to title appeal.
How to use this catalog
Three closing instructions for the reader.
First, you do not need to run every approach. Most successful AI-native companies use two to four of the pricing architectures (typically one primary plus one or two complements), apply the revenue and cost mechanics universally, develop the planning approaches gradually, and report externally with the metrics that fit their stage. Use the Finance Diagnostic and the Strategic Fit Matrix to narrow your candidates.
Second, sequence matters more than perfection. A company that gets the basics right (Per-Call or Per-Seat pricing, Stripe + bookkeeping, three numbers tracked, simple forecast) for the first three years has better odds of long-term financial health than a company that builds elaborate finance infrastructure from day one. The basics scale; the infrastructure has to be torn down and rebuilt repeatedly.
Third, the AI era rewards finance functions that engineer their own data infrastructure. Five years ago, finance teams could rely on standard SaaS metrics in standard formats. In 2026, the metrics that matter — cohort margin with model-cost decay, outcome attribution accuracy, compute concentration, forecast accuracy under price decay — require custom data infrastructure that does not exist out of the box. The companies that win are the ones that hire AI Finance Engineers (or assign engineers to finance) early enough to build that infrastructure before it is needed.
Common beginner questions
A non-exhaustive list of questions beginners ask after reading this catalog.
"How is AI-native finance different from regular SaaS finance?"
Three structural differences. First, gross margins are 50–70% rather than 75–85% because compute is a meaningful share of cost. Second, pricing is frequently usage-based, outcome-based, or hybrid rather than pure subscription, which complicates revenue recognition. Third, forecasting must explicitly model compute-price decay (30–60%/year for foundation models), which traditional SaaS forecasts ignore. The mechanics of finance are otherwise the same — debits and credits work identically, ASC 606 applies to all software companies, and basic SaaS metrics still matter.
"Do I need a CFO?"
Not until at least $10M ARR, and often not until $25M+. Premature CFO hires destroy more value than they create. Use a fractional CFO or experienced controller until the company has the operational complexity that genuinely requires a full-time strategic finance leader.
"What's the difference between bookings and recognized revenue?"
Bookings are the contractual value of signed deals (e.g., a $1.2M one-year contract is $1.2M in bookings on the day it is signed). Recognized revenue is the GAAP revenue that hits the P&L as the company satisfies its obligations under the contract (e.g., $100K/month for the same contract, recognized over twelve months). For traditional SaaS, the two closely track. For AI-native companies with usage- or outcome-based contracts, the two diverge meaningfully — bookings can be 2–5x recognized revenue in early periods.
"How should I think about gross margin for an AI company?"
Calculate it including compute as a COGS line. AI-native gross margins of 60–70% are healthy; below 50% is a warning sign that pricing or cost structure has a problem. Do not benchmark against traditional SaaS norms (75–85%); the comparison is misleading.
"When should I worry about revenue recognition?"
The moment you sign your first contract. ASC 606 applies from day one. The complexity scales with contract structure: pure subscription (Per-Seat or Per-Call) is simple; outcome-based and value-based contracts are complex enough to require an AI-experienced revenue accountant.
"How do I forecast revenue when so much is unpredictable?"
Build the forecast in two layers: customer revenue (per-cohort, with retention and expansion modeled) and compute costs (with explicit decay-rate scenarios). Combine them to project gross margin. Run sensitivity analysis. Present a base case and a conservative case to the board. Do not pretend to certainty you do not have.
"What metrics should I report to my board?"
Tier 1 (canonical SaaS): ARR, NRR, gross margin, Burn Multiple, runway. Tier 2 (AI-specific): compute-as-percentage-of-revenue, cohort gross margin trend, pilot-to-production conversion, bookings vs. recognized revenue. Tier 3 (strategic): compute concentration risk, forecast accuracy, capital allocation breakdown. Most pre-Series-A companies need only Tier 1; Series A onward should add Tier 2 progressively; Series B onward should report all three.
"What if I'm a solo founder with no finance background?"
You have one job: keep an honest weekly view of revenue, gross margin (revenue minus compute and direct costs), and runway. Use Stripe + Pilot or Bench + Mercury. Skip everything else. When you raise capital, hire a fractional controller for the duration of diligence. Defer the rest of finance until you have $5M+ ARR.
Appendix A: Glossary
ARR (Annual Recurring Revenue). The annualized contracted revenue of subscription contracts. For AI-native companies with usage-based components, "ARR" typically refers to subscription components plus a normalized estimate of recurring usage revenue. (See Common motion failures — ARR inflation for the pilot-inclusion failure mode.)
ASC 606. The US accounting standard for revenue recognition (Accounting Standards Codification Topic 606, "Revenue from Contracts with Customers"), issued by FASB. Defines the five-step framework for recognizing revenue. (See Approach 6.)
Audit defensibility. The books' ability to survive scrutiny from auditors, investors, and acquirers. One of the five financial pillars.
Bookings. The contractual value of signed deals, regardless of when revenue is recognized. Differs meaningfully from recognized revenue for AI-native companies with usage- or outcome-based contracts. (See Approach 6.)
Burn Multiple. The ratio of cash burned to net new ARR, popularized by David Sacks. Lower is better. SaaS norms: under 1.5x is healthy; AI-native norms: under 2.0x is acceptable for early-stage growth-mode companies.
CAC (Customer Acquisition Cost). The fully-loaded cost to acquire one new customer. (See Marketing Catalog Motion 5; Sales Catalog cross-cutting concepts.)
CAC payback period. The time required for a customer's gross-margin contribution to repay the cost of acquiring them. Mature SaaS norms: 18 months or less; AI-native companies often acceptable longer due to model-cost decay tailwind.
Capital allocation. The strategic question of how to split incremental dollars across compute, people, customer acquisition, and runway. (See Approach 11.)
Capital efficiency. Revenue produced per dollar of capital deployed. Captured by metrics like Burn Multiple and Magic Number. One of the five financial pillars.
Cash runway. The number of months of operations the company can fund at current burn rate, given current cash. The most fundamental finance metric for early-stage companies.
Cohort analysis. Tracking groups of customers acquired in the same period over time, observing how their retention, revenue, and gross margin evolve. For AI-native companies, requires explicit decomposition between customer behavior and model-cost decay. (See Approach 8.)
Compute COGS. The cost of compute (foundation-model API calls, GPU rentals, inference infrastructure) that flows through cost of goods sold. Typically 20–60% of revenue for AI-native companies. (See Approach 7.)
Compute concentration risk. The percentage of compute spend concentrated with a single foundation-model provider. High concentration creates vendor risk traditional SaaS does not face. (See Cross-cutting concepts.)
Contribution margin. Revenue minus all variable costs (compute COGS, payment processing, hosting, customer-success time). The most important per-customer profitability metric.
Deferred revenue. Revenue collected (or contracted) but not yet recognized under GAAP. Common for AI-native companies with prepaid contracts and outcome-based pricing.
Forecast accuracy. The historical match between forecasted and actual revenue. A measure of finance-team predictive maturity.
FP&A (Financial Planning & Analysis). The finance function responsible for forecasting, budgeting, and strategic financial analysis. Typically distinct from accounting (which records what happened) and treasury (which manages cash).
Gross margin. Revenue minus cost of goods sold, expressed as a percentage of revenue. The most important profitability metric. AI-native norms: 50–70%; traditional SaaS norms: 75–85%.
GRR (Gross Revenue Retention). The percentage of recurring revenue retained from existing customers, excluding upsell. Always less than or equal to 100%.
Hybrid pricing. A pricing architecture combining two or more components (e.g., subscription + usage overage). The dominant architecture among $10M+ ARR AI-native companies in 2026. (See Approach 5.)
LTV (Lifetime Value). The total gross-margin contribution a customer is expected to produce over their lifetime as a customer.
LTV/CAC ratio. The ratio of customer lifetime value to customer acquisition cost. Healthy SaaS programs target LTV/CAC > 3.
Magic Number. New ARR added in a quarter divided by sales-and-marketing spend in the prior quarter, an efficiency metric popularized by SaaS investors. Above 1.0 is healthy.
Model-cost decay. The phenomenon of foundation-model prices falling 30–60% per year, producing a structural margin tailwind for AI-native companies. (See Approaches 8 and 10.)
NRR (Net Revenue Retention). The percentage of recurring revenue retained from existing customers including upsell. Above 100% indicates the existing customer base is growing in revenue terms.
Outcome attribution. The technical infrastructure required to prove which outcomes the AI delivered, used to support outcome-based revenue recognition. (See Approach 3 and Sales Catalog Motion 9.)
Per-call pricing / Usage pricing. A pricing architecture where customers pay per API call, per token, per second of audio, or per query. The dominant model for AI infrastructure. (See Approach 2.)
Per-outcome pricing. A pricing architecture where customers pay only when the AI delivers a defined result. Sometimes called "Service-as-Software." (See Approach 3.)
Per-seat pricing. A pricing architecture where customers pay a fixed fee per user. The traditional SaaS standard, increasingly inappropriate for AI-heavy products. (See Approach 1.)
Pilot. A short-duration paid engagement (typically 90 days, 10–25% of projected production contract size) used as an entry mechanism for enterprise AI sales. (See Approach 9 and Sales Catalog Motion 7.)
Pilot-to-production conversion rate. The percentage of pilots that convert to production contracts. Mature companies see 50–75%. (See Approach 9.)
Prepaid compute commitment. A contractual commitment to a foundation-model provider for a fixed compute volume in exchange for discount pricing. Treated as a prepaid asset on the balance sheet, expensed to COGS as consumed.
Predictability. Forecast accuracy. One of the five financial pillars.
Revenue recognition. The accounting question of when revenue counts on the books, governed by ASC 606 (US) or IFRS 15 (international). (See Approach 6.)
Runway. See Cash runway.
SaaS metrics. The canonical set of recurring-revenue business metrics: ARR, NRR, gross margin, CAC, CAC payback, LTV, Burn Multiple, Magic Number. Apply to AI-native companies but must be supplemented with AI-specific metrics. (See Approach 12.)
Service-as-Software. A label for outcome-based AI pricing models. Synonymous with Per-Outcome Pricing in most uses. (See Approach 3.)
Synthetic cost baseline. The cost a customer cohort would have incurred at original-acquisition-period prices, used to decompose cohort margin trends between behavior change and compute-price decay. (See Approach 8.)
Tier 1 / Tier 2 / Tier 3 metrics. A reporting framework for AI-native company investor reporting, distinguishing canonical SaaS metrics (Tier 1), AI-specific metrics (Tier 2), and strategic context (Tier 3). (See Approach 12.)
Variable consideration. Under ASC 606, the portion of a contract's transaction price that depends on uncertain future events (usage, outcomes, milestones). Must be estimated and constrained to reasonable reliability. (See Approach 6.)
Value-based pricing. A pricing architecture charging a percentage of measured customer value created. (See Approach 4 and Sales Catalog Motion 10.)
Notes
¹ The Bessemer Cloud Index and Bessemer Venture Partners' research at cloudindex.bvp.com track public-cloud-software gross margins and metrics; their writing on AI-native company economics is a key public source for compute-classification practices.
² Andreessen Horowitz's growth team, particularly Sarah Wang and Shangda Xu's writing on AI margins and unit economics, has been a leading voice on cohort-margin dynamics and compute-cost decay in AI-native companies through 2024–2026.
³ David Skok at Matrix Partners published the foundational SaaS-finance framework at forentrepreneurs.com; his work remains the canonical reference for SaaS metrics that AI-native finance builds on. His writing on the Burn Multiple, Magic Number, and CAC payback period informs the Tier 1 metrics framework.
⁴ Tomasz Tunguz's writing at tomtunguz.com and Theory Ventures research has been an ongoing source for AI-native finance benchmarks and trends through 2024–2026.
⁵ Christoph Janz at Point Nine Capital, particularly his "5 Ways to Build a $100M Business" framework, provides the SaaS-revenue-architecture foundation that AI-native pricing extends.
Other references and influences shaping the catalog: David Sacks on the Burn Multiple; Patrick Campbell at Profitwell on pricing strategy; FASB ASC 606 documentation; AICPA technical advisory committees on revenue recognition for software companies; the work of AI-experienced revenue accountants at Big Four firms developing audit-defensible practices for outcome-based and value-based contracts.