Axiom X: Observability Extends Verification
Axiom IX's pipeline verified everything before deployment — formatting, linting, types, tests, security, all green. James merged the pull request, the order management system deployed, and he went home. At 2:47 AM, his phone buzzed — his second middle-of-the-night crisis since joining the team. But this was different from the deployment script failure in Axiom I. That crisis was caused by bad orchestration. This one was caused by something no test suite could catch: a customer service ticket reporting that shipping rates were wrong for international orders during peak traffic.
He checked the test suite — all fifty-three TDG (Test-Driven Generation) specifications passed. He checked the CI pipeline — green across every stage. He checked the type system — zero errors. Everything his pre-deployment verification said was "this system works correctly." But in production, right now, under real load, it did not.
James opened the server logs. What he found was useless:
Processing order...
Processing order...
Processing order...
ERROR: something went wrong
Processing order...
print("Processing order...") — scattered through the code from his earliest development days. No timestamps. No request IDs. No indication of which order failed, why it failed, or how many orders were affected. He had no metrics to show whether the error rate was 0.1% or 50%. He had no traces to show where the request spent its time. His comprehensive test suite, his type system, his CI pipeline — none of them could tell him what was happening right now, in production, to real users.
"Your tests verify that the code is correct," Emma told him the next morning. "But correct code can still fail in production. Load causes timeouts. Network hiccups drop connections. Memory fills up under traffic patterns your tests never simulated. You need a different kind of verification — one that watches the system while it runs."
This is Axiom X.
The Problem Without This Axiom
James's 2:47 AM incident exposed the gap in Axioms I through IX. Consider what those nine axioms gave him:
- Axiom V (Types Are Guardrails): Caught structural errors at compile time
- Axiom VII (Tests Are the Specification): Verified behavior against fifty-three TDG specifications
- Axiom IX (Verification is a Pipeline): Automated every pre-deployment check
This was powerful. But it all happened before the code reached users. Once deployed, James was blind. His system was:
- Passing all tests but slowly degrading under real production load
- Returning correct shipping rates for test inputs but wrong rates under concurrent requests
- Green on CI but silently timing out when the database connection pool was exhausted
- Functioning perfectly for 95% of orders but failing for the 5% that hit an untested edge case in international surcharge calculation
Pre-deployment verification answers: "Does this code work correctly?" Post-deployment observability answers: "Is this code working correctly right now?" Both questions matter. Neither answer substitutes for the other.
The Axiom Defined
Axiom X: Observability Extends Verification. Runtime monitoring extends pre-deployment verification. Tests verify behavior before deployment; observability verifies behavior in production. Together they form a complete verification system.
The word "extends" is precise. Observability does not replace testing — it extends the verification boundary from "before deployment" to "always." James's TDG tests from Axiom VII verified that calculate_shipping() returned the right values for eleven specific inputs. Observability verifies that the same function returns the right values for every request, under any load, at any time:
| Phase | Tools | What It Catches | When |
|---|---|---|---|
| Pre-deployment | Linting, types, tests, CI | Logic errors, type mismatches, regressions | Before users see it |
| Post-deployment | Logs, metrics, traces, alerts | Performance degradation, edge cases, real-world failures | While users experience it |
A system with only pre-deployment verification is like a car that passes inspection but has no dashboard gauges. James's order management system had passed inspection. It had no gauges.
From Principle to Axiom
In Chapter 4, Principle 7 introduced observability as visibility into what AI is doing — seeing agent actions, understanding rationale, tracing execution. That principle focused on trust: if you cannot see what the agent does, you cannot trust it.
Axiom X takes this further. The principle is about human-AI collaboration transparency. The axiom is about production engineering discipline:
| Principle 7 (Chapter 4) | Axiom X (This Lesson) |
|---|---|
| See what the AI did | Monitor what the system is doing continuously |
| Activity logs for debugging | Structured logs, metrics, traces for operations |
| Trust through visibility | Confidence through measurement |
| Developer experience | Production reliability |
| "What happened?" | "What is happening right now, and is it normal?" |
Principle 7 gave you the mindset: make things visible. Axiom X gives you the engineering toolkit: structured observability as a first-class system concern, not an afterthought.
The Discipline That Preceded Observability
The term "observability" — borrowed from control theory, where it means "the ability to infer a system's internal state from its external outputs" — entered software engineering through the DevOps movement. In 2016, Google published the Site Reliability Engineering book, codifying practices their teams had developed for running services at planetary scale. The book's core insight was that reliability is not a property of software — it is a property of operations. Code that passes tests can still fail in production if nobody is watching.
Charity Majors, co-founder of Honeycomb, popularized the distinction between monitoring (watching known metrics for known thresholds) and observability (understanding system behavior from its outputs, including behaviors you did not anticipate). Monitoring answers: "Is the error rate above 5%?" Observability answers: "Why are international orders from the UK failing at 3am?" — a question you did not know to ask until the system told you.
James's print("Processing order...") was neither monitoring nor observability. It was noise — unstructured text that disappeared when the process restarted and told him nothing about which orders failed or why.
The Three Pillars of Observability
After the 2:47 AM incident, Emma walked James through the three pillars of production observability. "Each pillar answers a different question," she said. "And no single pillar suffices alone."
Pillar 1: Logs (What Happened?)
Logs are structured records of discrete events. They tell you what the system did at specific moments. Emma showed James the difference between his print statements and proper structured logging:
import structlog

logger = structlog.get_logger()

# Bad: what James had — unstructured, no context
print("Processing order...")

# Good: structured log with context — who, what, when, why
logger.info(
    "order_processing_started",
    order_id="ord-7891",
    customer_id="cust-456",
    endpoint="/api/orders/process",
    total_amount=127.50,
)
Structured logs use key-value pairs instead of free-form strings. This makes them machine-parseable — you can search, filter, and aggregate across millions of log entries programmatically. If James had this during the 2:47 AM incident, he could have searched for all orders with status=error in the last hour and seen exactly which customers were affected.
Pillar 2: Metrics (How Much? How Fast?)
Metrics are numerical measurements over time. They tell you about system behavior in aggregate. "Logs tell you what happened to one order," Emma explained. "Metrics tell you what is happening to all orders."
from prometheus_client import Counter, Histogram, Gauge

# Count events — how many orders are we processing?
orders_total = Counter(
    "orders_processed_total",
    "Total orders processed",
    ["order_type", "status"]  # "domestic"/"international", "success"/"error"
)

# Measure durations — how fast is shipping calculation?
shipping_duration = Histogram(
    "shipping_calculation_seconds",
    "Shipping rate calculation time in seconds",
    ["region"]  # "domestic", "international", "express"
)

# Track current state — how many orders are in flight right now?
orders_in_progress = Gauge(
    "orders_in_progress",
    "Currently processing orders"
)
Metrics answer questions like: "How many orders per second are we processing?" "What is the 95th percentile shipping calculation time?" "Is the error rate increasing?" During the 2:47 AM incident, metrics would have told James instantly: "Error rate spiked from 0.1% to 12% at 2:30 AM, affecting international orders only." Instead, he had no numbers at all.
Pillar 3: Traces (Where Did Time Go?)
Traces follow a single request through the entire system, showing how time was spent across components. "This is the pillar that would have solved your 2:47 AM problem in minutes," Emma told James.
from opentelemetry import trace

tracer = trace.get_tracer("order-service")

async def process_order(order):
    with tracer.start_as_current_span("process_order") as span:
        span.set_attribute("order_id", order.id)
        span.set_attribute("customer_id", order.customer_id)

        # Span 1: Validate order details
        with tracer.start_as_current_span("validate_order"):
            validated = validate_order(order)

        # Span 2: Calculate shipping — the 2:47 AM bottleneck
        with tracer.start_as_current_span("calculate_shipping") as ship_span:
            shipping = await calculate_shipping(validated)
            ship_span.set_attribute("region", shipping.region)
            ship_span.set_attribute("rate", shipping.rate)

        # Span 3: Apply discount
        with tracer.start_as_current_span("apply_discount") as disc_span:
            total = apply_discount(validated, shipping)
            disc_span.set_attribute("discount_applied", total.discount_amount)

        # Span 4: Save to database
        with tracer.start_as_current_span("save_order"):
            await save_order(validated, total)

        return total
A trace from this code might reveal: "Order ord-7891 took 4.2 seconds total — 0.1s for validation, 3.8s waiting for calculate_shipping(), 0.2s for discount, 0.1s for database storage." Without traces, James only knew the total time. With traces, he would know exactly where the bottleneck was — and during the 2:47 AM incident, he would have seen that calculate_shipping() was timing out under concurrent load, while every other span completed in milliseconds.
Why All Three Together
| Scenario | Logs Alone | Metrics Alone | Traces Alone | All Three |
|---|---|---|---|---|
| "Why is the system slow?" | Shows individual slow requests | Shows 95th percentile is high | Shows where time is spent | Full picture: which requests, how many, and exactly why |
| "Is something broken?" | Shows error messages | Shows error rate is 5% | Shows which service fails | Full picture: what errors, how widespread, and the exact failure path |
| "How much does this cost?" | Shows per-request token counts | Shows total token usage trend | Shows which operations consume tokens | Full picture: cost per user, per feature, trending over time |
Python Observability Toolkit
After understanding the three pillars conceptually, James was ready to implement them. Emma showed him the tools he would use for his order management system.
Structured Logging with structlog
import structlog
import logging
import sys

def configure_logging():
    """Configure structlog for production JSON output."""
    structlog.configure(
        processors=[
            structlog.contextvars.merge_contextvars,
            structlog.processors.add_log_level,
            structlog.processors.TimeStamper(fmt="iso"),
            structlog.processors.StackInfoRenderer(),
            structlog.processors.JSONRenderer(),
        ],
        wrapper_class=structlog.make_filtering_bound_logger(logging.INFO),
        logger_factory=structlog.PrintLoggerFactory(file=sys.stdout),
    )

configure_logging()
logger = structlog.get_logger()
This produces machine-parseable JSON output:
{"event": "request_processing_started", "request_id": "req-abc-123", "user_id": "user-456", "level": "info", "timestamp": "2025-06-15T14:32:15.123Z"}
Log Levels: Signal vs. Noise
Choosing the right log level determines whether logs are useful or overwhelming. Emma taught James a simple rule: "Each level answers a different question for a different audience."
| Level | Purpose | Example | Production Visibility |
|---|---|---|---|
DEBUG | Development details | Variable values, loop iterations | Off in production |
INFO | Normal operations | Request started, task completed | Always visible |
WARNING | Unexpected but handled | Retry succeeded, fallback used | Always visible |
ERROR | Failures requiring attention | API call failed, invalid input | Triggers alert |
CRITICAL | System-level failures | Database down, out of memory | Wakes someone up |
# Each level serves a distinct purpose in James's order system
logger.debug("discount_calculation_details", rate=0.15, subtotal=127.50)
logger.info("order_processed", order_id="ord-7891", total=108.38, duration_ms=45)
logger.warning("shipping_rate_slow", order_id="ord-7892", duration_ms=2800, threshold_ms=1000)
logger.error("shipping_calculation_failed", order_id="ord-7893", error="timeout", retry_count=3)
logger.critical("database_connection_lost", host="orders-db.example.com")
Correlation IDs: Connecting the Dots
During the 2:47 AM incident, James had seen ERROR: something went wrong in his logs but could not connect it to a specific order or customer. A correlation ID ties all log entries for a single request together — solving exactly this problem:
import uuid
import structlog

def create_request_context(request):
    """Bind a correlation ID to all logs for this request."""
    correlation_id = str(uuid.uuid4())
    structlog.contextvars.clear_contextvars()
    structlog.contextvars.bind_contextvars(
        correlation_id=correlation_id,
        user_id=request.user_id,
    )
    return correlation_id
Now every log entry in that order's lifecycle shares the same correlation_id. When customer service reported the 2:47 AM issue, James could have searched for the correlation ID and seen the complete story — from order submission through discount calculation, shipping rate lookup, and the exact point of failure.
Observability for AI Agents
As James integrated more AI-generated code into his order management system, he discovered that AI agents introduce observability challenges that traditional web applications do not face. The AI that generated his shipping calculator and discount logic had its own failure modes — and monitoring them required new dimensions.
Dimension 1: Token Usage Tracking
When James used Claude Code to generate his shipping calculator, each generation consumed tokens — and costs varied dramatically depending on how he prompted. Tokens are both your cost driver and your quality signal.
import structlog

logger = structlog.get_logger()

class TokenTracker:
    """Track token usage per request, per user, per model."""

    def log_usage(self, request_id: str, response):
        usage = response.usage
        logger.info(
            "token_usage",
            request_id=request_id,
            input_tokens=usage.input_tokens,
            output_tokens=usage.output_tokens,
            total_tokens=usage.input_tokens + usage.output_tokens,
            model=response.model,
            estimated_cost=self._estimate_cost(usage, response.model),
        )

    def _estimate_cost(self, usage, model: str) -> float:
        """Estimate cost based on model pricing."""
        # Rates change frequently — load from config or environment
        rates = {
            "gpt-4o": {"input": 0.0025, "output": 0.01},
            "claude-sonnet-4": {"input": 0.003, "output": 0.015},
        }
        rate = rates.get(model, {"input": 0.01, "output": 0.03})
        return (
            (usage.input_tokens / 1000) * rate["input"]
            + (usage.output_tokens / 1000) * rate["output"]
        )
Dimension 2: Response Quality Metrics
James noticed that sometimes Claude Code generated a shipping function that compiled and passed type checks but produced subtly wrong rates for edge cases. Unlike traditional APIs, AI responses can be "correct" structurally but poor in quality.
from prometheus_client import Histogram, Counter

# Track response characteristics that correlate with quality
response_length = Histogram(
    "agent_response_length_tokens",
    "Length of agent responses in tokens",
    buckets=[50, 100, 200, 500, 1000, 2000, 5000]
)

# Track when responses need human correction
corrections_total = Counter(
    "agent_corrections_total",
    "Times a user corrected or rejected agent output",
    ["correction_type"]  # "factual", "tone", "incomplete", "wrong_format"
)

# Track conversation depth (more turns may indicate confusion)
conversation_turns = Histogram(
    "agent_conversation_turns",
    "Number of turns before task completion",
    buckets=[1, 2, 3, 5, 8, 13, 21]
)
Dimension 3: Error Rate Monitoring
AI agents fail differently from traditional software — they can fail silently by producing plausible but wrong output. A shipping function that returns $0.00 for every international order does not throw an exception. It looks correct structurally. Only observability catches it.
from prometheus_client import Counter

# Explicit failures (easy to catch)
explicit_errors = Counter(
    "agent_errors_total",
    "Explicit agent failures",
    ["error_type"]  # "timeout", "rate_limit", "context_overflow", "invalid_response"
)

# Implicit failures (harder — detected through quality signals)
quality_flags = Counter(
    "agent_quality_flags_total",
    "Responses flagged for quality concerns",
    ["flag_type"]  # "too_short", "repetitive", "off_topic", "hallucination_risk"
)
To catch silent failures, James learned two techniques: baseline comparison (alert when today's output distribution deviates from last week's — if average shipping cost suddenly drops 90%, something is wrong even though no errors fired) and shadow testing (run the new AI-generated function alongside the old one on real inputs, flag any divergence for human review before cutting over).
Dimension 4: Cost Per Operation
James's traditional order processing had fixed infrastructure costs — the server cost the same whether it handled ten orders or ten thousand. AI agents are different: they have variable per-request costs that scale with usage.
import structlog
from prometheus_client import Histogram

logger = structlog.get_logger()

cost_per_operation = Histogram(
    "agent_cost_per_operation_dollars",
    "Cost per agent operation in dollars",
    ["operation_type"],  # "chat", "code_review", "summarize", "translate"
    buckets=[0.001, 0.005, 0.01, 0.05, 0.1, 0.5, 1.0]
)

def track_operation_cost(operation_type: str, total_tokens: int, model: str):
    """Track the cost of each operation for budget monitoring."""
    cost = estimate_cost(total_tokens, model)
    cost_per_operation.labels(operation_type=operation_type).observe(cost)

    if cost > 0.10:  # Alert threshold
        logger.warning(
            "high_cost_operation",
            operation_type=operation_type,
            cost_dollars=cost,
            total_tokens=total_tokens,
            model=model,
        )
The Feedback Loop: Observe, Insight, Improve, Verify
Observability is not just about watching — it drives a continuous improvement cycle. James experienced this firsthand after the 2:47 AM incident:
1. OBSERVE: Structured logs reveal shipping calculation timeouts under load
       |
2. INSIGHT: "International shipping rates fail when concurrent requests exceed 50"
       |
3. IMPROVE: Add connection pooling and request queuing to shipping API calls
       |
4. VERIFY: Write a load test (Axiom VII) that simulates 100 concurrent orders
       |
5. DEPLOY: CI pipeline (Axiom IX) validates the fix passes under load
       |
6. OBSERVE: Monitor production to confirm shipping timeouts have stopped
       |
   [Repeat]
This is where observability and testing become a unified system. The 2:47 AM incident discovered a failure mode James's test suite never anticipated. That discovery became a new load test. The load test now prevents the same regression. And observability confirms, every night, that shipping calculations stay fast under real traffic. The verification system grows stronger with each cycle — observability feeds testing, testing feeds confidence, confidence feeds deployment, and observability watches the result.
The Complete System: All Ten Axioms
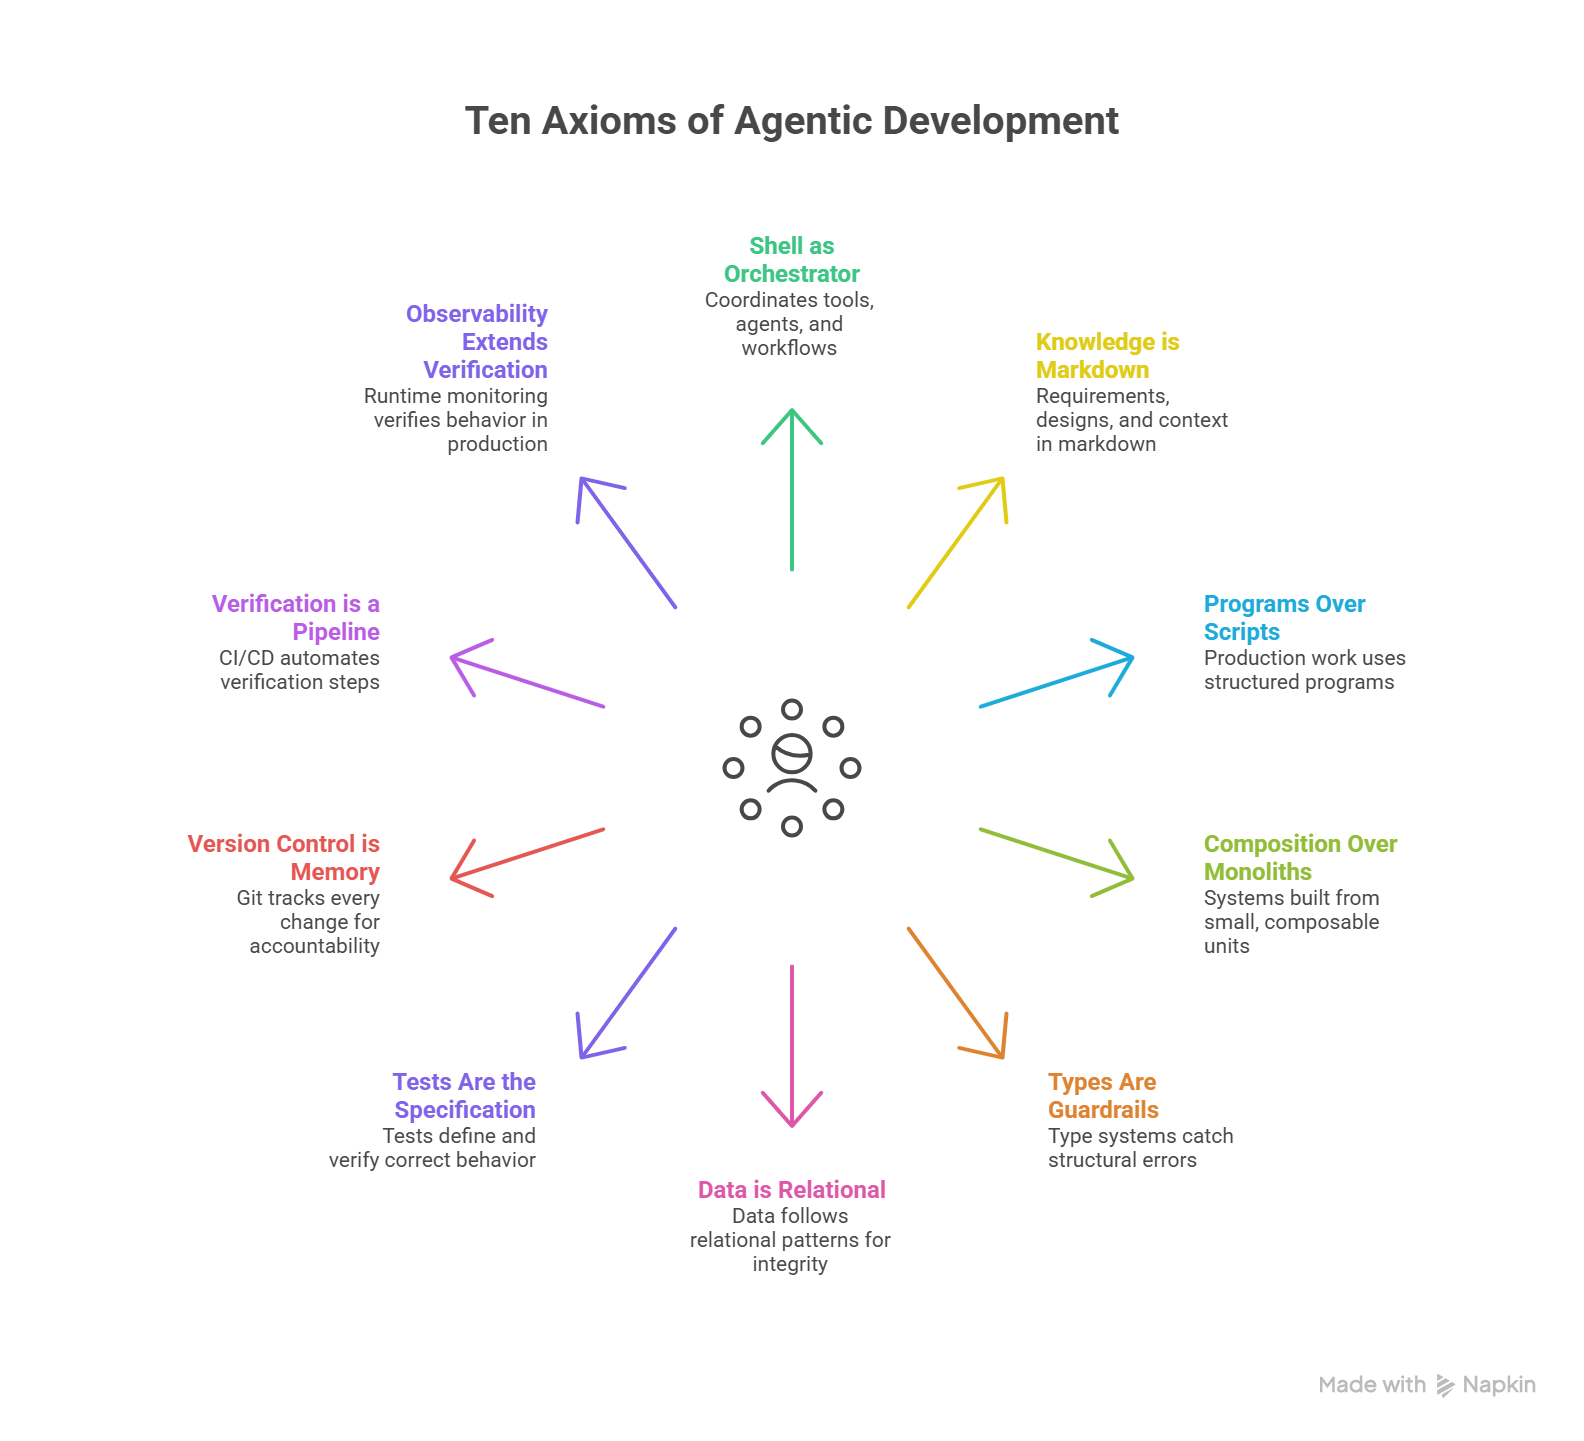
This is the final axiom. Together, the ten axioms form a coherent system for agentic software development — and James has lived every one of them.
Trace James's order management system through the complete stack — every axiom he learned this chapter:
- Shell orchestrates (I): James uses Claude Code to coordinate development — generating code, running tests, deploying changes
- Spec in markdown (II): His order management requirements live in
spec.md, readable by both humans and AI - Proper program (III): His shipping calculator is a structured Python program with modules, not a loose script
- Composed from units (IV):
calculate_shipping(),apply_discount(), andvalidate_order()are independent, composable functions - Types enforce contracts (V):
OrderRequest,ShippingRate, andDiscountResultare typed dataclasses — the compiler catches structural errors before runtime - Data stored relationally (VI): Orders, customers, and shipping rates live in properly normalized database tables with foreign keys
- Tests specify behavior (VII): Fifty-three TDG specifications define what "correct" means for every discount rule and shipping calculation
- Git remembers everything (VIII): Every change to the shipping logic is tracked, reversible, and attributable — James can show exactly what changed and why
- Pipeline verifies (IX): CI runs formatting, linting, type checking, all fifty-three tests, and a security scan on every push
- Production is observed (X): Structured logs, metrics, and traces confirm the order system works for real customers under real load — and alert James when it does not
No single axiom is sufficient. Without observability, James's tests pass but he is blind to the 2:47 AM shipping failure. Without tests, his observability has no baseline for "correct." Without types, his discount calculations silently corrupt when someone passes a string where a float belongs. The axioms are not a menu to choose from — they are a system that works together, and James learned that lesson one axiom at a time.
Anti-Patterns
Picture the unobservable system. The code is clean, the tests pass, the pipeline is green, and the system is deployed. Then something goes wrong. Not catastrophically — subtly. Response times creep up. Error rates tick from 0.2% to 0.8%. A handful of international orders fail silently every hour. Nobody notices because nothing alerts, nothing dashboards, nothing trends.
The developers check the logs and find print("Processing order...") repeated ten thousand times with no timestamps, no order IDs, no error context. They check metrics and find none. They check traces and find none. The system is a black box running in production, and the only signal that anything is wrong comes from customer service tickets trickling in over days.
This was James's order management system at 2:47 AM — and it is every system that treats observability as optional.
| Anti-Pattern | Why It Fails | The Fix |
|---|---|---|
| Print statements in production | Unstructured, no levels, no context, lost when process restarts — exactly what James had | Use structlog with JSON output and persistent log aggregation |
| No error alerting | "We'll notice eventually" means customers notice first — James learned this at 2:47 AM | Define alert thresholds; wake someone for CRITICAL, notify for ERROR |
| Logging everything at DEBUG | Noise overwhelms signal; storage costs explode | Use appropriate log levels; DEBUG off in production |
| No correlation between requests | Impossible to trace a single order's journey through the system | Add correlation IDs; bind context at request start |
| Observability as afterthought | "Add monitoring later" means after the first production incident — James added it because of his incident | Design observability into the system from the start, like testing |
| Metrics without baselines | "Is 200ms shipping calculation time good or bad?" — you cannot answer without history | Establish baselines first; alert on deviation, not absolute values |
| Monitoring only happy paths | You only track successful orders; failed shipping calculations are invisible | Instrument error paths with the same rigor as success paths |
Try With AI
Prompt 1: Replace Print Statements with Structured Logging
I have a Python order processing function that uses print statements for debugging,
just like James had before his 2:47 AM incident. Help me refactor it to use structlog
with proper production observability.

Here is my current code:

def process_order(order):
    print(f"Processing order {order.id}")
    if order.total > 1000:
        print("Large order detected!")
    try:
        shipping = calculate_shipping(order)
        print(f"Shipping calculated: {shipping}")
        result = charge_payment(order, shipping)
        print(f"Payment successful: {result}")
    except Exception as e:
        print(f"ERROR: Payment failed: {e}")
    print("Order processing complete")

For each print statement, help me understand:
1. What log level should this be? (DEBUG, INFO, WARNING, ERROR, CRITICAL)
2. What structured context should I add? (order_id, customer_id, amounts, durations)
3. Why is the structured version better when debugging a 2 AM production incident?

Then show me the complete refactored version using structlog with JSON output.
What you're learning: The difference between development-time debugging (print statements) and production-grade observability (structured logging). Each log statement has an audience (developer vs. log aggregation system) and a purpose (debugging vs. monitoring vs. alerting). James's print("Processing order...") told him nothing at 2:47 AM — your structured version would tell you exactly which order failed, why, and how many others were affected.
Prompt 2: Design AI Agent Monitoring
I am building an AI agent that helps customers with product recommendations.
Help me design a comprehensive observability strategy.

The agent:
- Receives natural language queries from customers
- Searches a product catalog (vector database)
- Generates personalized recommendations using an LLM
- Tracks which recommendations led to purchases

For each of the three observability pillars, help me define:

LOGS: What events should I log? At what levels? With what context?
METRICS: What numerical measurements matter? What are healthy baselines?
TRACES: What spans should I create? Where are the likely bottlenecks?

Also help me think about AI-specific monitoring:
- How do I detect when the agent is giving poor recommendations?
- How do I track cost per recommendation?
- What alerts should wake me up at 2 AM vs. notify me in the morning?

Walk me through the design decisions, explaining why each choice matters.
What you're learning: How to design observability for AI-specific systems where "correctness" is harder to define than in traditional software. James's order system had clear pass/fail criteria, but AI agents can be "up" while producing poor results. You are learning to think about quality signals, cost tracking, and silent failure modes — the same blindness James experienced at 2:47 AM, but in the AI dimension.
Prompt 3: The Full Verification Spectrum
I want to understand how all ten axioms of agentic development work together
by tracing a concrete feature through each one.

Take an order management system (like the one in this chapter) that needs a new
feature: "apply promotional discounts to international orders." Trace this feature
through all ten axioms:

1. Shell as Orchestrator: How does Claude Code coordinate this work?
2. Knowledge is Markdown: Where do the discount requirements live?
3. Programs Over Scripts: How is the discount logic structured?
4. Composition Over Monoliths: What composable functions make up this feature?
5. Types Are Guardrails: What type contracts exist between discount and shipping?
6. Data is Relational: How are promotions and order data stored?
7. Tests Are the Specification: What TDG tests define "correct" discount behavior?
8. Version Control is Memory: How are discount changes tracked and reversible?
9. Verification is a Pipeline: What does CI check before the discount code deploys?
10. Observability Extends Verification: What do you monitor to confirm discounts
    work correctly for real customers under real load?

For each axiom, give me a concrete example specific to this feature.
Then show me: what breaks if I skip any single axiom?
What you're learning: Systems thinking — how individual engineering practices compose into a coherent development methodology. The ten axioms are not separate rules but an interconnected system where each axiom addresses a gap that the others leave open. Skip types and discount calculations silently corrupt. Skip tests and you have no definition of "correct." Skip observability and your correct code fails silently under production load. This is the core insight of agentic development: rigorous engineering practices applied systematically, not selectively.
The Log Avalanche
There is a trap that catches developers right after they learn observability, and Emma warned James about it the same week he instrumented his order system: The Log Avalanche — logging everything at maximum detail because "more data is always better."
James's first instinct after the 2:47 AM incident was to add DEBUG-level logging to every function. Within a day, his order system was generating 2GB of logs per hour. The storage costs spiked. The log aggregation system slowed to a crawl. And when he actually needed to find a specific error, it was buried under millions of irrelevant entries — the signal drowned by noise he created trying to see everything.
"Observability is not about capturing everything," Emma told him. "It is about capturing the right things at the right level."
She had him write this on a sticky note:
| Level | When to Use | Example |
|---|---|---|
| DEBUG | Local development only — never in production | Variable values inside loops |
| INFO | Normal operations worth recording | order_created, payment_processed |
| WARNING | Handled problems that may need attention | Retry succeeded on third attempt |
| ERROR | Failures requiring investigation | Payment gateway returned 500 |
| CRITICAL | System-level emergencies | Database connection pool exhausted |
"If everything is important, nothing is."
The Log Avalanche extends beyond volume. Production logs may contain customer data — order details, shipping addresses, payment references. James learned to apply data minimization: log what you need for debugging and monitoring, never personally identifiable information. Apply retention policies — not every log entry needs to live forever. And remember that observability infrastructure itself needs security: access to production logs should be as controlled as access to the production database.
Key Takeaways
-
Pre-deployment verification is necessary but not sufficient. James's tests, types, and CI pipeline all passed — and his system still failed at 2:47 AM under production load. Observability extends the verification boundary from "before deployment" to "always."
-
The three pillars answer different questions. Logs tell you what happened to a specific order. Metrics tell you how many orders are affected and how fast the system is degrading. Traces tell you where in the request lifecycle time was spent. No single pillar replaces the others.
-
Structured logging replaces print statements.
print("Processing order...")is noise.logger.info("order_processed", order_id="ord-7891", duration_ms=45)is actionable intelligence. The difference is the difference between searching ten thousand identical lines and filtering byorder_idto find the exact failure. -
Observability drives a feedback loop. The 2:47 AM incident discovered a failure mode. That discovery became a load test. The load test now prevents the same regression. And observability confirms, every night, that the fix holds. Each cycle makes the verification system stronger.
-
The ten axioms are a system, not a checklist. James traced his order management feature through every axiom — from shell orchestration through production monitoring. Skip any one, and a gap opens. The axioms work together because software development is a system, and systems need complete coverage to be reliable.
The Complete Journey
James closed his laptop and looked at the order management system dashboard — green across every metric, structured logs flowing cleanly, traces showing sub-second response times even during the evening traffic peak. Three months ago, he had stared at print("Processing order...") in a panic at 2:47 AM, unable to tell which orders were failing or why.
The distance between then and now was ten axioms.
He had started with a shell that orchestrated his tools instead of manual copy-paste between windows. He had captured his requirements in markdown that both he and Claude Code could read. He had structured his discount calculator as a proper program with modules and imports, not a loose script. He had composed his system from small, focused functions — calculate_shipping(), apply_discount(), validate_order() — each doing one thing well. He had wrapped those functions in types that caught structural errors before they reached production. He had stored his orders and customers in properly normalized tables with foreign keys enforcing integrity.
Then came the verification stack. Test-Driven Generation gave him fifty-three specifications that defined "correct" — and caught the $12,000 discount bug before a single customer saw it. Git gave him memory — every change tracked, reversible, attributable, with commit messages that explained why. His CI pipeline automated every check — formatting, linting, types, tests, security — so that nothing reached production without passing all of them. And finally, observability extended that verification into production itself — structured logs, metrics, and traces watching the system while real customers used it, alerting him when reality diverged from expectation.
"You didn't just learn ten rules," Emma told him. "You built a system. Each axiom covers a gap the others leave open. That is what agentic development means — not AI writing code for you, but AI and engineering discipline working together, from the first shell command to the last production metric."
James nodded. The 2:47 AM incident had been the worst night of his career. It had also been the beginning of everything he built after.