Autoscaling on Kubernetes: HPA, VPA, KEDA, and Cluster Autoscaler
You deployed your AI microservice with 3 replicas. At 2 AM, all three pods sit idle, consuming RAM and burning your DigitalOcean credit. At noon, traffic spikes and 3 replicas can't keep up: users see latency, requests queue, and webhooks time out. Fixed replica counts waste money during quiet periods and fail during busy ones.
For an AI Employee that talks to one customer's WhatsApp, this matters even more. The service is idle 95% of the day. You're paying for 100% of the day. Multiply by 50 customers and the math is brutal.
Autoscaling matches capacity to demand automatically. But there is no single autoscaler. Kubernetes ships with four independent autoscalers that operate at different levels of the stack. Most engineers learn HPA first and assume that's "autoscaling." It's actually one quarter of the picture, and the most common production outages are caused by understanding only one or two layers.
By the end of this lesson you'll have the full mental model, a microservice that scales 0 to N to 0 based on real HTTP traffic behind a Gateway, and a recipe for repeating the pattern across many tenants without burning the cluster bill.
The Four Levels of Autoscaling
Before any installation, get the mental model straight. Read this picture top to bottom: each level depends on the one below it.
┌─────────────────────────────────────────────────────────────┐
│  LEVEL 4 - CLUSTER LEVEL                                    │
│  Cluster Autoscaler (CA)  /  Karpenter                      │
│  Scales: NODES (VMs in your cloud account)                  │
│  Question: "Do I have enough machines?"                     │
└─────────────────────────────────────────────────────────────┘
                              ▲
                              │ if pods can't schedule
                              │
┌─────────────────────────────────────────────────────────────┐
│  LEVEL 3 - WORKLOAD HORIZONTAL (event-driven)               │
│  KEDA                                                       │
│  Scales: REPLICA COUNT (pods, including down to 0)          │
│  Question: "Are events arriving that need processing?"      │
└─────────────────────────────────────────────────────────────┘
                              ▲
                              │ wraps and extends HPA
                              │
┌─────────────────────────────────────────────────────────────┐
│  LEVEL 2 - WORKLOAD HORIZONTAL (resource-driven)            │
│  HPA (Horizontal Pod Autoscaler)                            │
│  Scales: REPLICA COUNT (pods, minimum 1)                    │
│  Question: "Do I have enough copies of my app?"             │
└─────────────────────────────────────────────────────────────┘
                              ▲
                              │ orthogonal
                              │
┌─────────────────────────────────────────────────────────────┐
│  LEVEL 1 - WORKLOAD VERTICAL                                │
│  VPA (Vertical Pod Autoscaler)                              │
│  Scales: POD RESOURCES (CPU/RAM per pod)                    │
│  Question: "Is each pod the right size?"                    │
└─────────────────────────────────────────────────────────────┘
These four operate independently. A request can trigger any combination:
- CPU spike on existing pods: HPA adds replicas.
- All replicas full and the node has no capacity: HPA tries to add a pod, the pod is
Pending, Cluster Autoscaler adds a node, the pod schedules. - Pod consistently using 100% of its memory request: VPA recommends a bigger pod size.
- WhatsApp message arrives at a tenant scaled to zero: KEDA wakes the deployment from 0 to 1, which may pull in Cluster Autoscaler to add a node first.
Three rules that fall out of this picture:
- HPA's minimum is always 1. It cannot scale to zero. This is a hard limit.
- VPA modifies pod resource requests. It does not add or remove pods.
- KEDA is the only tool that scales to zero, and the only tool that scales on event sources (HTTP requests, cron schedules, queue depth, anything).
- Cluster Autoscaler is the only tool that affects your bill directly. Pods scaled to zero on nodes that still exist still cost money.
Most AI workloads use HPA, KEDA, and Cluster Autoscaler together. KEDA does the 0 to 1 transition, HPA (managed by KEDA under the hood) does the 1 to N scale-out, and Cluster Autoscaler does the node math underneath. VPA stays in Off mode as a measurement tool. You'll see this in action below.
Lab Setup: A Cluster You Can Practice On
Before going further, set up the lab environment that every exercise in this lesson will use. You can do this on any working cluster: Minikube, kind, k3s, Docker Desktop Kubernetes, or any managed cluster (DOKS, EKS, GKE, AKS).
What works where
| Section | Local cluster (Minikube/kind/k3s) | Managed cluster (DOKS/EKS/GKE/AKS) |
|---|---|---|
| HPA + VPA + KEDA cron | ✅ Full | ✅ Full |
| KEDA HTTP add-on (via port-forward) | ✅ Full | ✅ Full |
| KEDA HTTP add-on (via Gateway external IP) | ⚠ No public IP, use port-forward | ✅ Full |
| KEDA Prometheus scaler | ✅ With optional add-on (see step 3) | ✅ With optional add-on |
| KEDA Kafka scaler | ⚠ Needs Strimzi (optional add-on) | ⚠ Needs Strimzi or managed Kafka |
| Cluster Autoscaler / Karpenter | ❌ Concept-only on local | ✅ Cloud-only |
If you're on a local cluster, you'll skip Cluster Autoscaler exercises and read those sections as concept material. Everything else runs end-to-end.
Step 1: Verify metrics-server
kubectl get deployment metrics-server -n kube-system
If "not found":
kubectl apply -f https://github.com/kubernetes-sigs/metrics-server/releases/latest/download/components.yaml
On Minikube: minikube addons enable metrics-server. On k3s and managed clusters: built in.
Step 2: Deploy the starter app
Every HPA, KEDA cron, KEDA HTTP, and load-test exercise in this lesson uses the same starter app: a Deployment named task-api running podinfo, a small Go service designed for Kubernetes demos. Why podinfo and not a custom build:
GET /api/inforeturns JSON quickly — useful as a hot endpoint for HPA load tests, where request volume drives CPU.GET /delay/{seconds}simulates slow responses — perfect for p95 latency scaling.GET /metricsexposeshttp_requests_totaland friends — no instrumentation needed for the Prometheus scaler exercise.GET /healthzandGET /readyzare built in — perfect for cold-start simulations.- Public image at
ghcr.io/stefanprodan/podinfo, image size ~30 MB, fast pull.
Apply this manifest to create the namespace, Deployment, and Service:
# starter-app.yaml
apiVersion: v1
kind: Namespace
metadata:
  name: task-api
---
apiVersion: apps/v1
kind: Deployment
metadata:
  name: task-api
  namespace: task-api
  labels:
    app: task-api
spec:
  replicas: 2
  selector:
    matchLabels:
      app: task-api
  template:
    metadata:
      labels:
        app: task-api
    spec:
      containers:
        - name: task-api
          image: ghcr.io/stefanprodan/podinfo:6.7.1
          ports:
            - name: http
              containerPort: 9898
          resources:
            requests:
              cpu: 100m # required for HPA on CPU
              memory: 128Mi
            limits:
              cpu: 500m
              memory: 512Mi
          readinessProbe:
            httpGet:
              path: /readyz
              port: 9898
            initialDelaySeconds: 1
            periodSeconds: 5
          livenessProbe:
            httpGet:
              path: /healthz
              port: 9898
            initialDelaySeconds: 1
            periodSeconds: 10
---
apiVersion: v1
kind: Service
metadata:
  name: task-api
  namespace: task-api
spec:
  selector:
    app: task-api
  ports:
    - name: http
      port: 8000 # the lesson references this port everywhere
      targetPort: 9898 # podinfo's actual listen port
kubectl apply -f starter-app.yaml
kubectl get pods -n task-api
Expected output:
NAME                        READY   STATUS    RESTARTS   AGE
task-api-xxxxxxxx-xxxxx     1/1     Running   0          15s
task-api-xxxxxxxx-xxxxx     1/1     Running   0          15s
Tour podinfo's endpoints (do this before any autoscaling exercise)
Before scaling anything, see what the app actually does. Otherwise the load tests below feel magical and the Prometheus metrics feel arbitrary. Port-forward the Service to your laptop:
kubectl port-forward -n task-api svc/task-api 8000:8000
Leave that running in one terminal. In a second terminal, walk through every endpoint the rest of the lesson uses:
1. The default page — what your "service" is.
curl http://localhost:8000/
You'll get a JSON page with the pod's hostname, version, runtime, and a list of available endpoints. This is what the Gateway → interceptor → service path will return at the end of the lesson when a cold-start completes.
2. /api/info — same info, structured.
curl http://localhost:8000/api/info | jq .
JSON with hostname, version, color, message. Useful as a "is the pod alive" check during autoscaling demos.
3. /healthz and /readyz — what Kubernetes uses.
curl -i http://localhost:8000/healthz
curl -i http://localhost:8000/readyz
Both return 200 OK. The livenessProbe and readinessProbe in the Deployment hit these. If /readyz ever returns non-200, Kubernetes stops sending the pod traffic. The KEDA HTTP interceptor uses readiness to decide when to flush queued requests after cold-start.
4. Driving CPU on demand. THIS IS WHAT DRIVES HPA.
Heads up about
/cpu/{n}: older podinfo tutorials told you to hit/cpu/1to burn CPU. In current podinfo (6.x), that endpoint returns in milliseconds and does not peg CPU per request. Don't rely on it. Drive CPU through sustained request volume instead — each request costs JSON serialization and request handling, and at sufficient concurrency the per-pod CPU climbs above the HPA threshold reliably.
Watch CPU in one terminal (note: kubectl top does not support -w; use watch to refresh):
watch kubectl top pod -n task-api
Then drive sustained load from another terminal. A short burst won't work — metrics-server averages over a longer window than the burst lasts, so a 2-second spike never registers. You need the loop to keep running:
# Sustained loop — Ctrl-C to stop
while true; do curl -s http://localhost:8000/api/info > /dev/null; done
You'll see the pod's CPU column climb to a real percentage of requests.cpu (which is what HPA measures, not absolute CPU). That same climb is what HPA reads from metrics-server. If a single sustained loop isn't enough to push CPU over the threshold on a fast cluster, run several in parallel:
for i in $(seq 1 20); do
  (while true; do curl -s http://localhost:8000/api/info > /dev/null; done) &
done
# To stop all background loops:
# kill $(jobs -p)
5. /delay/{seconds} — slow responses on demand.
time curl -s http://localhost:8000/delay/3 -o /dev/null
Returns after roughly 3 seconds. This is what drives the p95 latency scaling exercise — when many requests hit /delay/2, the p95 in Prometheus rises and the latency-based ScaledObject scales out.
6. /metrics — the Prometheus scrape target.
curl -s http://localhost:8000/metrics | grep '^http_requests_total' | head
You'll see lines like:
http_requests_total{method="GET",path="/api/info",status="200"} 3
http_requests_total{method="GET",path="/healthz",status="200"} 17
This is the metric the KEDA Prometheus scaler queries. podinfo emits it for free; you don't have to instrument anything. When step 3 (kube-prometheus-stack) is installed and the ServiceMonitor is applied, Prometheus scrapes this endpoint every 15s and the PromQL sum(rate(http_requests_total{service="task-api"}[1m])) becomes meaningful.
Map of endpoints to lesson exercises
| podinfo endpoint | Used by |
|---|---|
/api/info | HPA load test (volume-driven CPU), Gateway → interceptor smoke test |
/delay/{seconds} | KEDA Prometheus p95 latency scaler |
/metrics | KEDA Prometheus scaler (request rate) |
/healthz, /readyz | Liveness/readiness probes, cold-start sim |
/ | Default JSON page; same content as /api/info |
You now know what the starter app actually does. Stop the port-forward (Ctrl-C) and continue. The starter app is ready for every exercise below.
Step 3 (optional): Prometheus stack for the Prometheus scaler exercise
The KEDA Prometheus scaler exercise needs a running Prometheus that's scraping task-api. The simplest install is kube-prometheus-stack:
helm repo add prometheus-community https://prometheus-community.github.io/helm-charts
helm repo update
helm install kube-prom prometheus-community/kube-prometheus-stack \
  --namespace monitoring --create-namespace
Then add a ServiceMonitor so Prometheus scrapes podinfo's /metrics:
# task-api-servicemonitor.yaml
apiVersion: monitoring.coreos.com/v1
kind: ServiceMonitor
metadata:
  name: task-api
  namespace: task-api
  labels:
    release: kube-prom # matches kube-prometheus-stack's selector
spec:
  selector:
    matchLabels:
      app: task-api
  endpoints:
    - port: http
      path: /metrics
      interval: 15s
kubectl apply -f task-api-servicemonitor.yaml
Now http_requests_total{service="task-api"} is queryable in Prometheus, and the KEDA Prometheus scaler examples below will work as written. Prometheus's in-cluster address is http://kube-prom-kube-prometheus-stack-prometheus.monitoring.svc.cluster.local:9090. Skip this step if you only want to run HPA, KEDA cron, and KEDA HTTP exercises — in that case, the "KEDA Prometheus Scaler" section later in the lesson reads as concept material and you do not need to apply its YAML.
Step 4 (optional): Strimzi for the Kafka scaler exercise
The Kafka scaler exercise needs a running Kafka cluster. If you don't already have one, install Strimzi (the Kubernetes-native Kafka operator):
kubectl create namespace kafka
kubectl apply -f 'https://strimzi.io/install/latest?namespace=kafka' -n kafka
Then apply a small single-broker Kafka cluster (suitable for class only, not production):
# kafka-cluster.yaml
apiVersion: kafka.strimzi.io/v1beta2
kind: Kafka
metadata:
  name: my-cluster
  namespace: kafka
spec:
  kafka:
    replicas: 1
    listeners:
      - name: plain
        port: 9092
        type: internal
        tls: false
    config:
      offsets.topic.replication.factor: 1
      transaction.state.log.replication.factor: 1
      transaction.state.log.min.isr: 1
    storage:
      type: ephemeral
  zookeeper:
    replicas: 1
    storage:
      type: ephemeral
kubectl apply -f kafka-cluster.yaml
Skip this if you don't need Kafka exercises. The lesson's Kafka scaler section also reads as concept material.
Cleanup
When you're done with the lesson, run these in order. The early steps remove autoscaling resources before the namespaces holding them get deleted, which avoids stuck Terminating namespaces.
# 1. Delete autoscaling resources first
kubectl delete hpa --all -n task-api 2>/dev/null
kubectl delete scaledobject --all -A 2>/dev/null
kubectl delete httpscaledobject --all -A 2>/dev/null
kubectl delete vpa --all -A 2>/dev/null

# 2. Delete demo deployments
kubectl delete deployment task-api -n task-api 2>/dev/null
kubectl delete deployment chatbot hello -n default 2>/dev/null
kubectl delete service chatbot -n default 2>/dev/null

# 3. Delete Gateway API resources
kubectl delete httproute --all -A 2>/dev/null
kubectl delete gateway --all -A 2>/dev/null
kubectl delete gatewayclass --all 2>/dev/null

# 4. Delete namespaces
kubectl delete namespace task-api 2>/dev/null

# 5. Uninstall Helm charts
helm uninstall keda-http -n keda 2>/dev/null
helm uninstall keda -n keda 2>/dev/null
kubectl delete namespace keda 2>/dev/null
helm uninstall eg -n envoy-gateway-system 2>/dev/null
kubectl delete namespace envoy-gateway-system 2>/dev/null

# 6. VPA cleanup (if installed) — vpa-down.sh leaves CRDs behind
cd ~/autoscaler/vertical-pod-autoscaler && ./hack/vpa-down.sh 2>/dev/null
kubectl delete crd verticalpodautoscalers.autoscaling.k8s.io 2>/dev/null
kubectl delete crd verticalpodautoscalercheckpoints.autoscaling.k8s.io 2>/dev/null

# 7. Optional add-ons (only if you installed step 3 / 4)
helm uninstall kube-prom -n monitoring 2>/dev/null
kubectl delete namespace monitoring 2>/dev/null
kubectl delete namespace kafka 2>/dev/null
You now have everything the rest of this lesson needs. Keep this terminal open.
Level 1: HPA (Horizontal Pod Autoscaler)
What it does: changes the replicas field on a Deployment based on observed metrics.
What it cannot do: scale to zero. The minimum is always 1 replica.
The control loop
HPA is a continuous control loop running inside Kubernetes:
Every 15 seconds:
  1. Read current metrics (e.g., CPU usage per pod) from metrics-server
  2. Compute target replicas:
       desired = ceil(current_replicas × current_metric / target_metric)
  3. If desired ≠ current → call Deployment API to change replicas
  4. Sleep 15s, repeat
The math is that simple. If you're running 4 replicas at 80% CPU and target is 50%:
desired = ceil(4 × 80 / 50) = ceil(6.4) = 7 replicas
HPA adds 3 replicas. Within 15 to 30 seconds, the new pods are running, load distributes, and average CPU drops. On the next loop, HPA might compute that 6 replicas are enough and removes one. This is why HPA can oscillate if you set thresholds too aggressively: the formula is reactive, not predictive.
Prerequisites: metrics-server
HPA reads CPU and memory from the metrics-server API. Many distributions ship without it.
kubectl get deployment metrics-server -n kube-system
If the command returns "not found":
kubectl apply -f https://github.com/kubernetes-sigs/metrics-server/releases/latest/download/components.yaml
On k3s, metrics-server is built in. On managed clusters (DOKS, GKE, AKS), it's also built in. On Minikube, run minikube addons enable metrics-server.
What metrics HPA can use
Three categories:
- Resource metrics (built-in via metrics-server)
cpuis what most people usememoryworks but is tricky: memory rarely drops, so scale-down is sluggish
- Custom metrics (require an adapter such as
prometheus-adapter)- Application metrics like
http_requests_per_second - HPA queries through the metrics API just like CPU
- Application metrics like
- External metrics (require an external metrics adapter)
- Cloud queue depth, database connections, anything not in-cluster
- Usually replaced by KEDA in modern setups
Your first HPA
Assume you have a Deployment named task-api running in namespace task-api. Create the HPA:
# task-api-hpa.yaml
apiVersion: autoscaling/v2
kind: HorizontalPodAutoscaler
metadata:
  name: task-api-hpa
  namespace: task-api
spec:
  scaleTargetRef:
    apiVersion: apps/v1
    kind: Deployment
    name: task-api
  minReplicas: 2
  maxReplicas: 10
  metrics:
    - type: Resource
      resource:
        name: cpu
        target:
          type: Utilization
          averageUtilization: 70
Apply and check:
kubectl apply -f task-api-hpa.yaml
kubectl get hpa -n task-api
Output:
NAME           REFERENCE             TARGETS   MINPODS   MAXPODS   REPLICAS   AGE
task-api-hpa   Deployment/task-api   23%/70%   2         10        2          30s
The TARGETS column reads "current/target." When current exceeds 70%, HPA adds pods. When it drops well below, HPA removes pods (down to minReplicas).
For the first 30–60 seconds after applying, you'll see
cpu: <unknown>/70%in the TARGETS column. That's not a bug — metrics-server hasn't gathered enough samples yet. Wait a minute and re-run. If<unknown>persists past two minutes, your pods almost certainly don't haverequests.cpuset (see "The single most common HPA bug" below).
Sidebar — does
replicas: 2already autoscale? No.replicas: 2is a fixed target. Kubernetes maintains exactly 2 pods, no more, no less, regardless of load. HPA is what makes the replica count variable. Without HPA, your Deployment is locked at whatever number you set.
Multi-metric HPA: scaling on CPU and memory together
You can give HPA more than one metric. It scales based on whichever metric requires more replicas (the safer choice):
apiVersion: autoscaling/v2
kind: HorizontalPodAutoscaler
metadata:
  name: task-api-hpa-multi
  namespace: task-api
spec:
  scaleTargetRef:
    apiVersion: apps/v1
    kind: Deployment
    name: task-api
  minReplicas: 2
  maxReplicas: 10
  metrics:
    - type: Resource
      resource:
        name: cpu
        target:
          type: Utilization
          averageUtilization: 70
    - type: Resource
      resource:
        name: memory
        target:
          type: Utilization
          averageUtilization: 80
For services that swing on memory (LLM context windows, embeddings caches), this is often more useful than CPU alone.
The behavior block: the part most tutorials skip
Default HPA scales aggressively up and slowly down. The default is reasonable but often wrong for AI workloads. The behavior block lets you tune it:
apiVersion: autoscaling/v2
kind: HorizontalPodAutoscaler
metadata:
  name: task-api-hpa-tuned
  namespace: task-api
spec:
  scaleTargetRef:
    apiVersion: apps/v1
    kind: Deployment
    name: task-api
  minReplicas: 2
  maxReplicas: 10
  metrics:
    - type: Resource
      resource:
        name: cpu
        target:
          type: Utilization
          averageUtilization: 70
  behavior:
    scaleUp:
      stabilizationWindowSeconds: 60
      policies:
        - type: Percent
          value: 100 # double the replica count
          periodSeconds: 15
        - type: Pods
          value: 4 # OR add up to 4 pods
          periodSeconds: 15
      selectPolicy: Max # whichever is more aggressive
    scaleDown:
      stabilizationWindowSeconds: 300 # wait 5 min before any scale-down
      policies:
        - type: Percent
          value: 25 # remove at most 25% per minute
          periodSeconds: 60
Read this as policy:
- Scale up fast. Every 15 seconds, double the pods or add 4, whichever is more.
- Wait 5 minutes of consistent low load before scaling down.
- Scale down slow. At most 25% reduction per minute.
The stabilizationWindowSeconds is the most important field. Without it, brief load drops cause HPA to remove pods, then more load arrives, HPA adds them back: oscillation. The stabilization window forces HPA to look at the last N seconds and use the highest recommendation in that window.
Watching HPA scale
Open two terminals.
Terminal 1:
kubectl get hpa task-api-hpa -n task-api -w
Terminal 2: generate sustained load against podinfo. Each request costs JSON serialization plus request handling, and at high enough rate the per-pod CPU climbs above the 70% threshold. Use the curlimages/curl image rather than busybox so you get HTTP keep-alive — without it, a sustained loop opens a new TCP connection per request and exhausts the pod's ephemeral ports within ~30 seconds (you'd see Cannot assign requested address).
kubectl run load --rm -it --image=curlimages/curl --restart=Never -- \
  sh -c 'while true; do
    curl -s -o /dev/null --keepalive-time 60 \
      http://task-api.task-api.svc.cluster.local:8000/api/info
  done'
After roughly a minute you'll see HPA's TARGETS column climb past 70% and REPLICAS increase from 2 to 3, then 4, then plateau (HPA distributes the load across the new replicas, and average utilization drops). Stop the load (Ctrl-C the load pod) and within a few minutes replicas drop back to 2 once the scaleDown.stabilizationWindowSeconds window elapses.
If a single sustained loop isn't enough to push CPU above threshold on a fast cluster, run several load pods in parallel (kubectl run load2 ..., load3 ...).
A short burst won't work. A common first attempt is
for i in $(seq 1 200); do curl ... & donefrom a single shell. Don't bother — 200 concurrent requests finish in ~2 seconds, but metrics-server averages CPU over a longer window than the burst lasts, so the spike never registers and HPA never scales. You need the loop to keep running.
Don't use podinfo's
/cpu/{n}for this. Older tutorials suggest hitting/cpu/1to burn CPU per request. In current podinfo (6.x) that endpoint returns in milliseconds and won't drive HPA. Use the sustained volume approach above.
If you see
Cannot assign requested addressfrom the load pod, that's the load generator hitting Linux's TCPTIME_WAITephemeral-port limit, not a Kubernetes failure. HPA has already scaled by then. Use the keepalive variant above to avoid it; if you still hit it, restart the load pod.
The single most common HPA bug
If you set HPA on CPU and your pods don't have CPU requests set, HPA cannot work. The formula divides current CPU by request, so missing request = division by zero = <unknown> in the TARGETS column.
# This pod cannot be scaled by HPA on CPU
resources:
  limits:
    cpu: 500m
  # NO requests block!
# This pod can be scaled by HPA on CPU
resources:
  requests:
    cpu: 100m # required for HPA
  limits:
    cpu: 500m
When HPA genuinely doesn't matter
Worth pausing on: HPA is not always necessary. There are cases where static replicas are correct:
- Predictable traffic (internal tool, fixed user base, no spikes):
replicas: Nworks. - Single-tenant pods that scale to zero: HPA is irrelevant; you're using KEDA
min: 0, max: 1. - Very low traffic services: the overhead of HPA + metrics-server isn't worth it.
For an AI Employee per tenant, most tenants have load that fits in one or two pods most of the time. You don't actually need HPA per tenant; you need KEDA scale-to-zero with min: 0, max: 1 (or maybe 2). HPA's "scale 3 to 10 based on CPU" use case doesn't apply to a personal AI assistant for one customer.
You'll still use HPA for shared services in your stack: the queue worker, the API gateway, the notification dispatcher, the centralized RAG retrieval service. Those handle aggregate load from all tenants and benefit from elastic 2 to 20 scaling.
The honest framing: HPA gives you elasticity within a workload. For per-tenant AI Employees, KEDA is the answer. For shared cluster services, HPA is the answer.
What HPA cannot do, summarized
- Scale to zero. The floor is 1.
- Scale on anything other than CPU/memory without a custom metrics adapter.
- Scale on event sources (HTTP request count, queue depth, cron schedules).
For AI Employees that idle most of the time, HPA alone is wasteful. You'll set HPA on bursty stateless shared services (the 1 to N scale-out) and use KEDA for the 0 to 1 transition.
Level 2: VPA (Vertical Pod Autoscaler)
What it does: changes requests and limits on pods based on historical usage.
What it cannot do: add or remove pods.
Where HPA says "I need more pods," VPA says "this pod needs more CPU."
The architecture: three controllers, not one
VPA is three separate controllers that work together:
┌─────────────────────┐
│  VPA Recommender    │  Watches metrics (Prometheus-style)
│                     │  Computes "right size" recommendations
│                     │  Writes to VPA CR status
└──────────┬──────────┘
           │
           ▼
┌─────────────────────┐
│  VPA CR (your YAML) │  Stores recommendations
└──────────┬──────────┘
           │
           ▼
┌─────────────────────┐
│  VPA Updater        │  In Auto mode: evicts pods that need resizing
│                     │  Pods get re-created with new requests
└─────────────────────┘

┌─────────────────────┐
│  VPA Admission      │  At pod creation: rewrites requests with VPA's
│  Controller         │  recommendation before pod gets scheduled
└─────────────────────┘
Installing VPA
VPA does not ship with Kubernetes by default. Install it from the kubernetes/autoscaler repo:
git clone https://github.com/kubernetes/autoscaler.git
cd autoscaler/vertical-pod-autoscaler
./hack/vpa-up.sh
Do not use
git clone --depth 1here.vpa-up.shrunsgit switch --detach vertical-pod-autoscaler-1.6.0internally, which requires the full git history. A shallow clone fails withfatal: invalid reference: vertical-pod-autoscaler-1.6.0. Use a full clone.
Output:
customresourcedefinition.apiextensions.k8s.io/verticalpodautoscalers.autoscaling.k8s.io created
customresourcedefinition.apiextensions.k8s.io/verticalpodautoscalercheckpoints.autoscaling.k8s.io created
deployment.apps/vpa-recommender created
deployment.apps/vpa-updater created
deployment.apps/vpa-admission-controller created
When you're done with the lesson, ./hack/vpa-down.sh removes the Deployments but leaves the CRDs behind because it uses the deprecated apiextensions.k8s.io/v1beta1 API. Clean those up manually:
./hack/vpa-down.sh
kubectl delete crd verticalpodautoscalers.autoscaling.k8s.io
kubectl delete crd verticalpodautoscalercheckpoints.autoscaling.k8s.io
The three modes
| Mode | Behavior |
|---|---|
Off | Recommendations only. Nothing changes on running pods. |
Initial | Modify requests only at pod creation. Existing pods stay as-is. |
Auto | Actively evict running pods to apply new requests. |
Use Off in production. You read recommendations, manually update your Deployment, redeploy.
Auto mode evicts pods to resize them, which is destructive for stateful workloads and surprising for stateless ones. Almost everyone runs VPA in recommendation mode and applies the suggestions manually.
apiVersion: autoscaling.k8s.io/v1
kind: VerticalPodAutoscaler
metadata:
  name: task-api-vpa
  namespace: task-api
spec:
  targetRef:
    apiVersion: apps/v1
    kind: Deployment
    name: task-api
  updatePolicy:
    updateMode: "Off" # Recommendations only
  resourcePolicy:
    containerPolicies:
      - containerName: task-api
        minAllowed:
          cpu: 100m
          memory: 128Mi
        maxAllowed:
          cpu: 2
          memory: 2Gi
resourcePolicy is the safety belt: even if the recommender wants to set CPU to 4 cores, maxAllowed clamps it.
Reading the recommendation
After a few hours of traffic, VPA produces a recommendation:
kubectl describe vpa task-api-vpa -n task-api
Output (relevant section):
status:
  recommendation:
    containerRecommendations:
      - containerName: task-api
        lowerBound:
          cpu: 25m
          memory: 262144k
        target:
          cpu: 50m
          memory: 524288k
        upperBound:
          cpu: 200m
          memory: 1Gi
Read this as: "Your pod actually needs 50 millicores and 512 MiB. If you're requesting more, you're wasting cluster capacity."
The recommendation algorithm uses histograms of historical CPU and memory usage. It computes:
- Lower bound: the minimum the pod could use without performance issues.
- Target: what VPA would set if you applied the recommendation now.
- Upper bound: the maximum to handle spikes.
These take hours of data to converge. A VPA installed an hour ago has wide bounds because it doesn't have enough samples. Don't trust early recommendations.
The HPA + VPA conflict
Don't run HPA on CPU and VPA in Auto mode on the same Deployment. Both will fight over CPU requests:
- HPA on CPU at 70% target says "scale out to keep average at 70%."
- VPA on CPU says "give each pod more CPU so it can handle more load."
The result is unpredictable oscillation. The supported combinations:
- HPA on CPU + VPA in
Offmode (read recommendations only). - HPA on a custom metric (request rate) + VPA in
Autofor memory only.
When VPA is genuinely useful
- Initial sizing. You don't know what to set
requeststo. Run VPA inOffmode for a week, read the recommendation, ship it. - OOMKilled investigations. Pods crashing for memory? VPA tells you what they actually need.
- Cost reviews. Read VPA recommendations across all namespaces to find over-provisioned workloads.
For day-to-day autoscaling, VPA is a measurement tool, not a scaling tool. The "scaling" happens because you read the recommendation and edit your Deployment.
For AI workloads, the simplest pattern is VPA in Off mode for sizing recommendations + KEDA for actual scaling decisions.
Level 3: KEDA (Kubernetes Event-Driven Autoscaling)
What it does: scales replica count on any event source, including down to zero.
What it cannot do: modify pod resources (that's VPA's job).
KEDA fills the gap that HPA leaves. Three things HPA cannot do that KEDA can:
- Scale to zero.
- Scale on non-resource metrics without a separate adapter.
- Scale on external events (queue depth, cron schedules, cloud queues, HTTP request rate from cold-start).
Architecture: KEDA reuses HPA under the hood
┌─────────────────────────────────────────────────────┐
│   ScaledObject CR (your YAML)                       │
│   says: "scale this Deployment based on this        │
│          event source, between min and max"         │
└──────────────────────┬──────────────────────────────┘
                       │
                       ▼
┌─────────────────────────────────────────────────────┐
│   KEDA Operator (cluster-wide controller)           │
│   - Reads ScaledObjects                             │
│   - Polls event sources (Kafka, cron, HTTP, etc.)   │
│   - Creates a HIDDEN HPA pointing at your Deployment│
│   - Updates the HPA's metrics from event data       │
└──────────────────────┬──────────────────────────────┘
                       │
                       ▼
┌─────────────────────────────────────────────────────┐
│   Hidden HPA (managed by KEDA)                      │
│   - Same control loop you already learned           │
│   - But with min=0 supported via KEDA's logic       │
└──────────────────────┬──────────────────────────────┘
                       │
                       ▼
                  Your Deployment
The clever part: KEDA reuses HPA. It doesn't reinvent scaling logic. It generates an HPA whose metrics come from KEDA's polled event source, and it intercepts the 0 to 1 transition (since HPA can't do that).
You can see the hidden HPA:
kubectl get hpa
NAME                          REFERENCE          TARGETS         MINPODS   MAXPODS
keda-hpa-my-scaledobject     Deployment/x       <unknown>/10    1         10
KEDA names them keda-hpa-<scaledobject-name>. Don't manage them directly: KEDA reconciles them constantly. Touch the ScaledObject, KEDA updates the HPA.
How scale-to-zero actually works
This is the part most people don't understand. HPA truly cannot go below 1. So how does KEDA scale to zero?
Answer: when KEDA decides the desired replica count is 0 (no events for the cooldown period), it bypasses the HPA entirely and sets the Deployment's spec.replicas to 0 directly through its own controller. The hidden HPA stays in place but goes inactive — its ScalingActive condition flips to False.
You can confirm this against your cluster. After the cron scaler scales the hello deployment to zero, run:
kubectl get hpa
NAME                  REFERENCE          TARGETS             MINPODS   MAXPODS   REPLICAS
keda-hpa-hello-cron   Deployment/hello   <unknown>/1 (avg)   1         1         0
The HPA is still there with REPLICAS: 0. That matters for production debugging: when something looks wrong with a scaled-to-zero workload, you can still kubectl describe hpa keda-hpa-<name> to see the last known metric values and conditions.
When events return, KEDA scales the Deployment back up to 1, the HPA's ScalingActive flips back to True, and from there the HPA handles further 1 → N scale-out the same way it always does.
Installing KEDA
helm repo add kedacore https://kedacore.github.io/charts
helm repo update
helm install keda kedacore/keda --namespace keda --create-namespace
Verify:
kubectl get pods -n keda
Output:
NAME                                                READY   STATUS    RESTARTS
keda-admission-webhooks-xxxxxxxx                    1/1     Running   0
keda-operator-xxxxxxxx                              1/1     Running   0
keda-operator-metrics-apiserver-xxxxxxxx            1/1     Running   0
Scalers: the event source plugins
KEDA ships with 70+ scalers out of the box. The ones you'll meet in this lesson:
| Scaler | Use case |
|---|---|
cron | Schedule-based scaling (scale up at 9 AM, down at 6 PM) |
prometheus | Any custom metric exposed via Prometheus |
kafka | Consumer lag (scale on unprocessed message count) |
http-add-on | HTTP request rate (separate add-on, special chicken-and-egg case) |
Other common ones (same pattern, different metadata): redis, aws-sqs-queue, azure-servicebus, gcp-pubsub, cpu, memory. The pattern is identical for every scaler:
spec:
  triggers:
    - type: <scaler-name>
      metadata:
        # scaler-specific config
        threshold: "<some-number>"
Before You Apply Any ScaledObject: Clean Up the HPA
KEDA generates its own hidden HPA (named keda-hpa-<scaledobject-name>). If a manually-created HPA from Level 1 is already pointed at the same Deployment, the two HPAs fight over the replicas field and the workload oscillates. Always delete pre-existing HPAs before applying a ScaledObject to the same Deployment.
# If you applied an HPA in Level 1, remove it now
kubectl delete hpa task-api-hpa -n task-api 2>/dev/null || true
kubectl get hpa -n task-api    # should be empty (or empty for that deployment)
The cron hello-world below uses a different Deployment (hello), so this matters mostly for the Prometheus scaler section later. Do it now anyway — it's the cleanest way to keep state under control.
KEDA Hello World: The Cron Scaler
The fastest way to feel KEDA work is the cron scaler. It needs no external infrastructure: no Prometheus, no Kafka, no HTTP traffic. Perfect for a first demo.
Deploy a trivial pod that does nothing:
kubectl create deployment hello --image=nginx --replicas=0
Note --replicas=0 (start at zero). Now apply a cron-based ScaledObject:
# hello-cron-scaler.yaml
apiVersion: keda.sh/v1alpha1
kind: ScaledObject
metadata:
  name: hello-cron
  namespace: default
spec:
  scaleTargetRef:
    name: hello
  minReplicaCount: 0
  maxReplicaCount: 1
  cooldownPeriod: 30 # essential for fast cron demos — see callout below
  triggers:
    - type: cron
      metadata:
        timezone: Asia/Karachi
        start: "*/5 * * * *" # Wake every 5 minutes
        end: "2-59/5 * * * *" # Sleep 2 minutes after waking
        desiredReplicas: "1"
Why
cooldownPeriod: 30? KEDA's default cooldown is 300 seconds (5 minutes), tuned for production queues where you don't want to scale to zero between bursts. For a cron demo with a 5-minute cycle, that default keeps the cooldown timer resetting before scale-down ever runs — your pod scales up but never scales down, and the demo looks broken. Lower it to 30s for class.
Cron
startandendmust produce alternating fire times. The pair above (*/5 * * * */2-59/5 * * * *) means "wake at minute 0/5/10/…, sleep at minute 2/7/12/…" — 2 minutes on, 3 minutes off per 5-minute cycle. If you speed it up to a 1-minutestart, theendmust also be on a 1-minute cadence or the windows overlap and the deployment oscillates. A clean fast variant for class demos:start: "*/2 * * * *" # wake at even minutes
end: "1-59/2 * * * *" # sleep at odd minutes — 1 min on, 1 min off
Apply:
kubectl apply -f hello-cron-scaler.yaml
Watch:
kubectl get pods -w
Within a few minutes, you'll see a hello pod appear at the next 5-minute mark, run for 2 minutes, then disappear. You just made a pod that exists only when you tell it to.
Inspect the hidden HPA while the pod is up:
kubectl get hpa
NAME                  REFERENCE          TARGETS              MINPODS   MAXPODS   REPLICAS
keda-hpa-hello-cron   Deployment/hello   <unknown>/1 (avg)    1         1         1
When the cron condition unfires, the deployment's replicas drops to 0 but the HPA stays visible in kubectl get hpa with REPLICAS: 0 and <unknown> targets — KEDA bypasses the HPA to set replicas directly (see the "How scale-to-zero actually works" section above), it does not delete the HPA.
The cron scaler is genuinely useful for things like "scale up the demo environment 10 minutes before class, scale down after." But pedagogically, its real purpose is to prove KEDA works without any external dependency. From here, every other scaler is the same pattern with a different trigger.
KEDA Prometheus Scaler
Beyond cron, the most common KEDA trigger is Prometheus. If your service exposes metrics (request rate, queue depth, latency percentiles, anything), KEDA can scale on them.
Scaling on request rate
apiVersion: keda.sh/v1alpha1
kind: ScaledObject
metadata:
  name: task-api-request-rate
  namespace: task-api
spec:
  scaleTargetRef:
    name: task-api
  minReplicaCount: 1
  maxReplicaCount: 20
  pollingInterval: 15
  cooldownPeriod: 300
  triggers:
    - type: prometheus
      metadata:
        serverAddress: http://prometheus.monitoring.svc.cluster.local:9090
        metricName: task_api_requests_per_second
        query: |
          sum(rate(http_requests_total{service="task-api"}[1m]))
        threshold: "50"
How it works:
- The query calculates requests per second over the last minute.
- When requests exceed 50/second per pod, KEDA adds a pod.
- Each additional pod is expected to handle roughly 50 requests/second.
Scaling on p95 latency
Scale when response times degrade, not just when requests pile up:
apiVersion: keda.sh/v1alpha1
kind: ScaledObject
metadata:
  name: task-api-latency
  namespace: task-api
spec:
  scaleTargetRef:
    name: task-api
  minReplicaCount: 2
  maxReplicaCount: 15
  triggers:
    - type: prometheus
      metadata:
        serverAddress: http://prometheus.monitoring.svc.cluster.local:9090
        metricName: task_api_p95_latency
        query: |
          histogram_quantile(0.95, sum(rate(http_request_duration_seconds_bucket{service="task-api"}[5m])) by (le))
        threshold: "0.5"
When p95 latency exceeds 500ms, KEDA adds pods to reduce load per instance. This is one of the most useful scaling signals for AI workloads where token generation latency is the user-facing SLO.
KEDA Kafka Scaler
For agents that consume from Kafka topics, scale on consumer lag: how many unprocessed messages are waiting.
apiVersion: keda.sh/v1alpha1
kind: ScaledObject
metadata:
  name: ai-agent-kafka-scaler
  namespace: ai-agents
spec:
  scaleTargetRef:
    name: ai-agent-worker
  minReplicaCount: 0 # Scale to zero when no messages
  maxReplicaCount: 50
  triggers:
    - type: kafka
      metadata:
        bootstrapServers: kafka.kafka.svc.cluster.local:9092
        consumerGroup: ai-agent-consumers
        topic: ai-tasks
        lagThreshold: "10"
How it works:
- KEDA queries Kafka for consumer group lag.
- When 10+ messages are waiting per partition, scale up.
- When the queue is empty for
cooldownPeriod, scale to zero.
For production Kafka clusters with SASL authentication, use a TriggerAuthentication resource:
apiVersion: keda.sh/v1alpha1
kind: TriggerAuthentication
metadata:
  name: kafka-auth
  namespace: ai-agents
spec:
  secretTargetRef:
    - parameter: sasl
      name: kafka-secrets
      key: sasl
    - parameter: username
      name: kafka-secrets
      key: username
    - parameter: password
      name: kafka-secrets
      key: password
---
apiVersion: keda.sh/v1alpha1
kind: ScaledObject
metadata:
  name: ai-agent-kafka-scaler
  namespace: ai-agents
spec:
  scaleTargetRef:
    name: ai-agent-worker
  minReplicaCount: 0
  maxReplicaCount: 50
  triggers:
    - type: kafka
      authenticationRef:
        name: kafka-auth
      metadata:
        bootstrapServers: kafka.kafka.svc.cluster.local:9092
        consumerGroup: ai-agent-consumers
        topic: ai-tasks
        lagThreshold: "10"
The TriggerAuthentication keeps secrets out of the ScaledObject and lets multiple ScaledObjects share the same credentials.
The HTTP Problem: Why Vanilla KEDA Isn't Enough
Cron is great for predictable schedules. Kafka is great when work arrives as messages. Most AI workloads are neither: a user sends a WhatsApp message at 11:43 PM on a Tuesday. You can't put that on a cron, and there's no broker holding the message for you.
The natural answer is "scale on HTTP request rate." But there's a chicken-and-egg problem: if the pod is at zero, there's no service to send the request to and no metric to measure. Vanilla KEDA can't solve this: it scales based on metrics that already exist, but HTTP requests to a non-existent pod produce no metrics.
The solution is the KEDA HTTP add-on, a separate component that solves the cold-start problem by inserting an interceptor between the gateway and your service.
Cold-start in detail
When a request arrives at a deployment that's at zero replicas:
t=0.0s   Request arrives
t=0.1s   Service has no endpoints
         Without HTTP add-on: connection failure or 5xx returned to caller
                              (depends on what's in front of the Service:
                              direct curl gets connection refused, an
                              Ingress/Gateway returns 503 or 502)
         With HTTP add-on:    request queued in interceptor
t=0.2s   KEDA detects pending request → scales 0 to 1
t=2.0s   Kubernetes scheduler places pod on a node
t=5.0s   Container image pulled (cached: 1s; uncached: 10s+)
t=8.0s   Container starts, application bootstraps
t=12.0s  Readiness probe passes
t=12.5s  Request forwarded to pod, response returned
Total: 10 to 30 seconds for the first request. Subsequent requests are fast because the pod is now warm.
For background workers consuming from queues, this is fine: the broker holds the message. For HTTP requests tied to a user's WhatsApp message or a webhook with a 10-second retry budget, 15 seconds of latency on cold start is often unacceptable.
The HTTP add-on doesn't make pods start faster. What it does is queue the request during cold-start so the caller sees one slow response instead of an error. That's the difference between "the AI is waking up, please wait" and "the AI is broken."
Installing the KEDA HTTP Add-on
The HTTP add-on is a separate Helm chart that depends on KEDA being installed.
helm install keda-http kedacore/keda-add-ons-http --namespace keda
Verify:
kubectl get pods -n keda
Output (now includes three new pods):
NAME                                                     READY   STATUS
keda-admission-webhooks-xxxxxxxx                         1/1     Running
keda-operator-xxxxxxxx                                   1/1     Running
keda-operator-metrics-apiserver-xxxxxxxx                 1/1     Running
keda-add-ons-http-controller-manager-xxxxxxxx            1/1     Running
keda-add-ons-http-interceptor-xxxxxxxx                   1/1     Running
keda-add-ons-http-external-scaler-xxxxxxxx               1/1     Running
Three new components:
- Controller watches for
HTTPScaledObjectcustom resources. - Interceptor is a proxy pod that queues requests during cold-start.
- External scaler is a gRPC service that tells KEDA how many pending requests exist.
The architecture:
External request
      │
      ▼
┌──────────────┐
│   Gateway    │  (Envoy Gateway, Ingress, etc.)
└──────┬───────┘
       │
       ▼
┌──────────────────────┐         ┌────────────────────┐
│  KEDA HTTP           │────────▶│  External Scaler   │
│  Interceptor         │ pending │  (gRPC)            │
│  (queues requests)   │ count   └─────────┬──────────┘
└──────┬───────────────┘                   │
       │ forwards once pod ready           ▼
       ▼                          ┌────────────────────┐
┌──────────────────────┐          │  KEDA Operator     │
│ Your Deployment      │◀─────────│  (scales 0 ↔ N)    │
│ (0..N replicas)      │  scale   └────────────────────┘
└──────────────────────┘
The interceptor is the key piece. It's a real proxy that sits between the gateway and your service. When your service is at zero, requests pile up in the interceptor's memory. When the pod is ready, the interceptor flushes the queue.
Your first HTTPScaledObject
Deploy a simple HTTP service at zero replicas. We'll reuse podinfo from the Lab Setup as the "chatbot" — it's already public, fast, and you've seen its endpoints, so the cold-start demo will return a real JSON response you recognize:
kubectl create deployment chatbot \
  --image=ghcr.io/stefanprodan/podinfo:6.7.1 \
  --replicas=0
kubectl expose deployment chatbot --port=8000 --target-port=9898
--target-port=9898 maps the Service's port 8000 to podinfo's actual listen port 9898. The HTTPScaledObject below references port 8000 on the Service, which is what the KEDA HTTP interceptor and Gateway API expect.
Now define an HTTPScaledObject:
# chatbot-http-scaler.yaml
apiVersion: http.keda.sh/v1alpha1
kind: HTTPScaledObject
metadata:
  name: chatbot
  namespace: default
spec:
  hosts:
    - chatbot.example.com
  scaleTargetRef:
    name: chatbot
    kind: Deployment
    apiVersion: apps/v1
    service: chatbot
    port: 8000
  replicas:
    min: 0
    max: 5
  scaledownPeriod: 60 # lowered from default 300s for class demo — see callout
  scalingMetric:
    requestRate:
      granularity: 1s
      targetValue: 10
      window: 30s
Why
scaledownPeriod: 60? The default is 300 seconds (5 minutes), tuned for production interactive workloads where you want the pod to stay warm between user messages. For a class demo, 5 minutes is too long to wait — students get bored and conclude scale-down doesn't work. Lower it to 60s while you're learning the mechanic; bump it back up to 300+ in production. (For interactive AI agents,scaledownPeriod: 600–900is often the right production value — see "Cold-Start Engineering" later in the lesson.)
Apply:
kubectl apply -f chatbot-http-scaler.yaml
What happens in the cluster:
- KEDA HTTP add-on registers the host
chatbot.example.comwith its interceptor. - The interceptor accepts any request whose
Host:header matches that hostname. - When a request arrives and the deployment is at zero, the interceptor queues it and signals the external scaler.
- The external scaler tells KEDA "1 pending request."
- KEDA scales the deployment from 0 to 1.
- Once the pod's readiness probe passes, the interceptor forwards the queued request.
But there's still a missing piece: how does the external request reach the interceptor in the first place? That's where Gateway API comes in.
Gateway API: How Traffic Reaches the Interceptor
A Kubernetes Service of type LoadBalancer exposes a single workload to the internet. When you have many services (and many tenants), managing a separate LoadBalancer per service gets expensive (each costs roughly $12-15/month on most clouds) and operationally clumsy.
Gateway API is the modern Kubernetes standard for routing external traffic to services. Think of it as one cloud LoadBalancer, many routes inside the cluster.
The mental model in three resources
┌──────────────────────────────────────────────────────────┐
│                                                          │
│    GatewayClass         ← installed once per controller │
│    (e.g. "envoy")          (think: a router model)       │
│         │                                                │
│         │ implements                                     │
│         ▼                                                │
│    Gateway              ← installed once per cluster    │
│    (one LoadBalancer)      (think: the physical router)  │
│         │                                                │
│         │ accepts routes                                 │
│         ▼                                                │
│    HTTPRoute            ← installed per service/tenant  │
│    (path/host rules)       (think: routing table entry) │
│                                                          │
└──────────────────────────────────────────────────────────┘
GatewayClassdefines what kind of router. Installed once when you set up the controller (e.g., Envoy Gateway).Gatewaydefines the actual router instance. Usually one per cluster. This is what gets a public IP via your cloud's LoadBalancer.HTTPRoutedefines which traffic goes where. One per service. Ties hostnames and paths to a backend.
The crucial advantage over old Ingress: HTTPRoutes can live in different namespaces from the Gateway. You can have one cluster-wide Gateway in gateway-system namespace, and 50 tenant namespaces each with their own HTTPRoute. The Gateway accepts all of them.
Installing Envoy Gateway
helm install eg oci://docker.io/envoyproxy/gateway-helm \
  --version v1.7.2 \
  --namespace envoy-gateway-system \
  --create-namespace
The version is pinned to
v1.7.2(latest stable as of this lesson's publication) so you and the reader are running the exact same release. Ifv1.7.2is no longer available when you read this, use the latest stablev1.xfrom the Envoy Gateway releases page — the GatewayClass + Gateway + HTTPRoute resources used below have been schema-stable across the v1 line.
Create the GatewayClass and Gateway:
# gateway.yaml
apiVersion: gateway.networking.k8s.io/v1
kind: GatewayClass
metadata:
  name: eg
spec:
  controllerName: gateway.envoyproxy.io/gatewayclass-controller
---
apiVersion: gateway.networking.k8s.io/v1
kind: Gateway
metadata:
  name: main-gateway
  namespace: envoy-gateway-system
spec:
  gatewayClassName: eg
  listeners:
    - name: http
      protocol: HTTP
      port: 80
      allowedRoutes:
        namespaces:
          from: All # Accept routes from any namespace
Apply and check:
kubectl apply -f gateway.yaml
kubectl get gateway -n envoy-gateway-system
Output:
NAME            CLASS   ADDRESS         PROGRAMMED
main-gateway    eg      203.0.113.42    True
The ADDRESS is your cloud LoadBalancer's external IP. That's where external traffic arrives.
Routing traffic to the KEDA HTTP interceptor
Define an HTTPRoute that sends chatbot.example.com traffic to the interceptor, not directly to the chatbot service:
# chatbot-route.yaml
apiVersion: gateway.networking.k8s.io/v1
kind: HTTPRoute
metadata:
  name: chatbot-route
  namespace: default
spec:
  parentRefs:
    - name: main-gateway
      namespace: envoy-gateway-system
  hostnames:
    - chatbot.example.com
  rules:
    - matches:
        - path:
            type: PathPrefix
            value: /
      backendRefs:
        - name: keda-add-ons-http-interceptor-proxy
          namespace: keda
          port: 8080
The full traffic path:
External request to chatbot.example.com
         │
         ▼
   Cloud LoadBalancer (IP: 203.0.113.42)
         │
         ▼
   Envoy Gateway (main-gateway)
         │ matches Host: chatbot.example.com
         ▼
   HTTPRoute (chatbot-route)
         │ backendRef → KEDA interceptor
         ▼
   KEDA HTTP Interceptor
         │ checks if chatbot pod is ready
         │ if not: queue request, signal KEDA to scale
         │ if yes: forward request
         ▼
   chatbot Deployment (0..5 replicas, scaled by KEDA)
Test it. Use time on the curl — without it the cold-start moment is invisible in the output:
# In one terminal
kubectl get pods -w

# In another, send a request and measure
time curl -H "Host: chatbot.example.com" http://203.0.113.42/
# ~10-15s on the first call (cold-start)

time curl -H "Host: chatbot.example.com" http://203.0.113.42/
# ~50ms on the second call (warm)
You'll watch the chatbot pod appear in real-time. The first request waits roughly 10 to 15 seconds (cold-start) — the interceptor queues it while KEDA scales 0→1 and the pod starts. The response eventually arrives. The second curl is instant. After scaledownPeriod seconds of no traffic, the pod scales back to zero.
That's the full loop: external traffic → Gateway → interceptor → scaled-to-zero deployment → cold-start → response.
Local development: skip the Gateway
For local testing on Minikube/k3s without a cloud LoadBalancer, talk to the interceptor directly via port-forward. Use three terminals so you actually see the cold-start moment instead of missing it:
Terminal 1 — watch the chatbot pod come and go:
kubectl get pods -w
Terminal 2 — keep a port-forward running to the KEDA interceptor:
kubectl port-forward -n keda svc/keda-add-ons-http-interceptor-proxy 8080:8080
Terminal 3 — measure cold-start vs warm response:
# First request: pod is at 0 replicas, cold-start path
time curl -H "Host: chatbot.example.com" http://localhost:8080/
# ~10-15s elapsed — interceptor queued the request, KEDA scaled 0→1, pod started, response delivered

# Second request immediately: pod is warm
time curl -H "Host: chatbot.example.com" http://localhost:8080/
# ~50ms elapsed — direct hit on the running pod

# Wait scaledownPeriod seconds (60 in the demo config above), then:
kubectl get pods    # chatbot pod should be gone
The time command is the proof. Without it, you see two JSON responses and miss the 10-second gap that's the whole point of the demo. With it, the cold-start cost is unmistakable.
Same behavior, no cloud LoadBalancer needed. Useful for development; in production, always go through a Gateway.
Level 4: Cluster Autoscaler (and Karpenter)
You've added pods. Eventually a pod can't schedule because every node is full. What scales the nodes?
Cluster Autoscaler: the original
What it does: watches for Pending pods that can't schedule. Provisions new nodes. Removes underutilized nodes.
The control loop:
Every 10 seconds:
  Phase 1 (scale up):
    - Find pods stuck in Pending due to resource constraints
    - Match them against node groups (instance types you've configured)
    - Provision new nodes via cloud API (AWS ASG, GCP MIG, Azure VMSS, DOKS pool)

  Phase 2 (scale down):
    - Find nodes utilized below threshold (default 50%)
    - Check if their pods can fit on other nodes
    - If yes, drain and delete
CA is conservative. It waits roughly 10 minutes after a node could be removed before actually removing it. This prevents flapping but means scale-down is slow.
CA understands node groups: sets of identical machines defined up-front:
node-group-1: 2 vCPU, 4 GB RAM (cheap, for general workloads)
node-group-2: 4 vCPU, 16 GB RAM (for memory-heavy AI inference)
node-group-3: spot instances (for batch workers)
CA picks which group to expand based on which pod's requirements match.
Enable it on DOKS when creating a node pool:
doctl kubernetes cluster node-pool create my-cluster \
  --name agents \
  --size s-2vcpu-4gb \
  --auto-scale \
  --min-nodes 1 \
  --max-nodes 10
--auto-scale flips on the autoscaler. --min-nodes 1 is the floor (you can't go below 1 node and keep a working cluster).
For AKS and GKE, the flag is slightly different but the concept is identical.
Karpenter: the modern alternative
What it does: same as CA but smarter. Instead of pre-defined node groups, Karpenter looks at the exact shape of pending pods and provisions the cheapest matching instance type right now.
If your pending pod needs 3 GB RAM and 1 CPU, CA might launch a 4-vCPU/16-GB node from your "general" group (wasting capacity). Karpenter looks at AWS's current spot prices and might launch a 2-vCPU/4-GB spot instance for 70% less.
For AI workloads with varied resource shapes, Karpenter often beats CA on cost. AKS now has Node Auto-Provisioning (NAP), GKE has Auto Provisioning, EKS has Karpenter natively. DOKS doesn't have a Karpenter equivalent yet.
Why this completes the cost story
You enabled scale-to-zero on 50 tenant pods. KEDA scales them all to zero. Your nodes still exist. You're paying.
Cluster Autoscaler closes the loop:
- Empty nodes → CA drains them → cluster shrinks.
- Pending pods → CA provisions nodes → cluster grows.
Without CA, KEDA only saves you compute within the existing node count. With CA, KEDA's savings translate to actual reduced cloud bill.
When morning traffic resumes, the first request triggers KEDA → pod pending → autoscaler provisions a node → pod schedules → traffic flows. The very first user of the day sees roughly 30 to 45 seconds of cold-start (node provisioning + pod cold-start). Subsequent users see nothing.
Putting It All Together: A Day in the Life
Here's a real scenario showing all four layers working together for an AI Employee service. Initial state: 1 cluster, 2 nodes, 50 tenants, ScaledObjects on all of them with min: 0.
3 AM Monday — everyone idle
- 0 pods running across all 50 tenants (KEDA scaled them to zero).
- Cluster Autoscaler drains 1 node → 1 node remaining.
- Cost: 1 minimal node + control plane.
8:30 AM Monday — first user wakes up, sends WhatsApp
- Webhook hits Gateway.
- KEDA HTTP interceptor queues request.
- KEDA scales
tenant-ahmeddeployment from 0 to 1. - Pod is
Pending(only 1 node, no capacity). - Cluster Autoscaler sees pending pod → provisions a new node (~30 sec).
- Pod schedules → cold-start (~10 sec).
- Interceptor forwards queued request → response delivered.
- User-visible latency: roughly 40 seconds for the first message of the day.
9:30 AM — many users active
- 8 tenants now have warm pods.
- Cluster Autoscaler has provisioned 3 nodes total.
- KEDA's hidden HPA keeps
tenant-ahmedat 1 replica because traffic is light per-tenant. - VPA in
Offmode silently records thattenant-ahmedcould shrink from 1 GB requests to 600 MB.
12 PM — peak
- 15 tenants active.
- One particularly chatty tenant has 3 replicas (KEDA's hidden HPA scaled out on request rate).
- 4 nodes total.
- Average node utilization: ~70%.
5 PM — quieting down
- Tenants idle one by one as users go offline.
- KEDA's
scaledownPeriod: 600keeps pods warm for 10 min after the last request. - After cooldowns elapse, pods scale to zero.
- Cluster Autoscaler waits 10 min of node-empty observation, then drains and removes 2 nodes overnight.
Result for the day:
- Peak usage: 4 nodes.
- Off-peak: 1 node.
- Average: ~2 nodes.
- Without autoscaling at any layer: 4 to 5 nodes constantly = 2 to 3× the cost.
Every layer played a role. Remove any one and the savings collapse.
The Per-Tenant Pattern: Many Customers, One Cluster
Here's the architectural payoff. You're running an AI Employee service for 50 customers. Each needs:
- Their own AI agent (isolated state, isolated config).
- Their own scale-to-zero behavior (so idle customers cost nothing).
- Their own routing (so traffic for customer A doesn't reach customer B).
The pattern:
ONE CLUSTER
  │
  ├── envoy-gateway-system namespace
  │     └── main-gateway (one LoadBalancer, public IP)
  │
  ├── keda namespace
  │     └── KEDA + HTTP add-on (cluster-wide controllers)
  │
  ├── tenant-ahmed namespace
  │     ├── Deployment/chatbot
  │     ├── Service/chatbot
  │     ├── HTTPScaledObject/chatbot   (min: 0, max: 3)
  │     └── HTTPRoute (host: ahmed.aiplatform.com)
  │
  ├── tenant-fatima namespace
  │     └── (same 4 resources, isolated)
  │
  └── ... (50 namespaces total)
Per-tenant resources: one namespace, one Deployment, one Service, one HTTPScaledObject, one HTTPRoute. Five YAML files per tenant. Everything else is shared.
In production, you'd templatize this with Helm or generate it from a Git-tracked tenant list. We're not writing the templating today; we're focusing on the architecture. Each tenant is a small, repeatable unit, and the shared infrastructure (Gateway, KEDA, the cluster itself) is paid for once.
The cost math
Assume 50 tenants, each with one chatbot pod that needs ~1 GB RAM when running. At any moment, ~10% of tenants are actively in conversation (5 of 50).
| Configuration | Pods running | Cluster RAM needed | Approximate monthly cost (DOKS) |
|---|---|---|---|
| Always-on, no autoscaling | 50 | ~55 GB | ~$500-700 |
| KEDA scale-to-zero, 10% active | ~5 | ~8 GB | ~$100-150 |
| KEDA + Cluster Autoscaler | ~5 (variable nodes) | ~5 GB peak | ~$60-100 |
That's a 5 to 10× reduction in infrastructure cost by setting min: 0 on each HTTPScaledObject and turning on Cluster Autoscaler. The unit economics of a Digital FTE business depend on this number working.
Cold-Start Engineering: Making the First Request Tolerable
The HTTP add-on queues the request, but it can't make your pod start faster. Three techniques drop cold-start from 30 seconds to under 10:
1. Keep container images small
# Bad — 1.02 GB
FROM python:3.12

# Good — 130 MB
FROM python:3.12-slim
Image pull is the single biggest cold-start variable. On a cold node with no cached layers, a 1 GB image takes roughly 10 seconds to pull; a 130 MB image takes roughly 1.5 seconds.
2. Optimize application startup
Python's import chain can take 3 to 5 seconds on cold start. Measure it:
import time
start = time.time()
# ... your imports ...
print(f"Imports took: {time.time() - start}s", flush=True)
If your app takes 8 seconds to become ready, every cold start costs 8 seconds. Lazy-load heavy modules (don't import the whole LangChain at startup if you only use one component). Preload models at build time. Avoid expensive computations in module-level code.
3. Tune scaledownPeriod
Default is 300 seconds (5 minutes). For interactive AI agents, 600 to 900 seconds is often better: if a user is in conversation, they'll likely send another message within 10 minutes, and keeping the pod warm during that window eliminates cold-start for the bulk of their session:
spec:
  scaledownPeriod: 900 # 15 minutes
Trade-off: you pay for 15 minutes of idle after each conversation ends. For a 50-tenant platform with 10% concurrent active, this still averages to roughly 10 active pods, far below 50.
When NOT to Scale to Zero
KEDA's scale-to-zero is powerful, but the wrong workloads will break in painful ways:
- Databases (Postgres, Redis, MongoDB). The data lives in the pod. Scaling to zero means losing the connection pool, breaking client connections, and (for non-persistent storage) data loss.
- Kafka brokers. The broker IS the message log. Scaling to zero loses offsets, consumer group state, and any messages held in memory but not yet flushed.
- OpenClaw and similar AI Employee runtimes. Stateful, single-instance, with WhatsApp channel sessions that need to stay paired. These need
minReplicaCount: 1. - Long-running jobs. Anything with a multi-hour task in flight will be killed when KEDA scales it to zero.
The right candidates for scale-to-zero are stateless HTTP services, queue consumers (the broker holds messages), and batch workers triggered by events. If your workload survives kubectl delete pod cleanly, it's probably safe to scale to zero. If it doesn't, leave minReplicaCount: 1.
The Decision Tree
When facing a new workload, walk this:
Is your workload stateless?
├── Yes → Scale-to-zero candidate
│         │
│         ├── Driven by HTTP requests?
│         │   └── KEDA + HTTP add-on
│         │
│         ├── Driven by queue/event?
│         │   └── KEDA + matching scaler (Kafka, Redis, etc.)
│         │
│         └── Predictable schedule?
│             └── KEDA cron scaler
│
└── No → Stateful, keep min: 1 or higher
          │
          ├── CPU-bound, well-understood load?
          │   └── HPA on CPU
          │
          ├── Variable load, unknown sizing?
          │   └── VPA in Off mode for sizing recommendations
          │
          └── Both burst load and unknown sizing?
              └── HPA on custom metric + VPA on memory only
Across all of the above:
- Always enable Cluster Autoscaler (or Karpenter where available) on a managed cloud.
- Never run VPA in Auto mode on workloads anyone depends on.
- Never run HPA + VPA in Auto mode on the same resource.
Common Pitfalls — Recognize Them in the Wild
1. "HPA isn't working."
Cause: pods don't have requests.cpu set. HPA can't compute utilization without a denominator.
Fix: add resources.requests.cpu to the Deployment.
2. "My pods scale up but never scale down."
Cause: scaleDown.stabilizationWindowSeconds is the default 300s, and you keep generating tiny load that resets it. Or memory metric (memory rarely drops, so memory-based scaling is one-way).
Fix: tune the stabilization window, or move to a metric that actually decays.
3. "KEDA scaled to zero, now my service won't wake up."
Cause: the trigger source isn't reachable. KEDA's pod can't reach Kafka, can't reach Prometheus, can't reach the cron field.
Fix: kubectl describe scaledobject <name> and read the events. The cause is always there.
4. "Cold-start takes 60 seconds, way more than expected."
Cause: large container image (slow pull), heavy app initialization (slow startup), or Cluster Autoscaler also provisioning a node (another ~30 sec). Each phase is independent and additive.
Fix: shrink the image, lazy-load imports, tune readiness probe initialDelaySeconds and periodSeconds.
5. "I scaled to zero but my cloud bill didn't drop."
Cause: Cluster Autoscaler not enabled. KEDA scaled the pods to zero but the nodes remained.
Fix: enable --auto-scale on your node pool.
6. "VPA changed my pod size and broke my app."
Cause: VPA in Auto mode evicted a pod mid-request.
Fix: switch to Off mode and apply manually.
7. "Autoscaling oscillates: pods constantly created and destroyed."
Cause: stabilization windows too short, thresholds too tight, or two autoscalers fighting. Fix: widen windows, loosen thresholds, audit for HPA+VPA on the same resource.
Lab Errors Quick Reference
If you hit one of these while running the lab exercises, this table tells you what's actually wrong (none of them indicate Kubernetes is broken — they indicate the demo command needs adjusting):
| What you see | Cause | Fix |
|---|---|---|
unknown shorthand flag: 'w' on kubectl top pod | kubectl top doesn't support -w | Use watch kubectl top pod -n task-api instead |
Cannot assign requested address from the load pod | Load generator exhausted Linux ephemeral ports (TCP TIME_WAIT) by opening a new connection per request | Use the curlimages/curl keepalive variant in the HPA load test, or restart the load pod |
HPA shows cpu: <unknown>/70% for more than ~2 minutes | metrics-server hasn't gathered samples (normal at first) OR pods don't have requests.cpu set | Wait 60s; if still unknown, add resources.requests.cpu to the Deployment |
Burst load (for i in $(seq 1 200); do curl ... & done) finishes but HPA never scales | metrics-server averages CPU over a longer window than the 2-second burst lasts | Use a sustained while true; do curl ...; done loop instead |
| KEDA cron pod scales up but never scales down | Default cooldownPeriod: 300 keeps resetting before the cron end window can trigger scale-down on a fast cycle | Set cooldownPeriod: 30 on the cron ScaledObject |
| Two HPAs visible on one Deployment, replicas oscillate | A manual HPA from Level 1 plus KEDA's hidden keda-hpa-* are both writing spec.replicas | kubectl delete hpa <manual-hpa-name> before applying any ScaledObject to that Deployment |
| HTTPScaledObject demo "doesn't scale down" within 5 minutes | Default scaledownPeriod: 300 (5 min) is the production default | Lower to scaledownPeriod: 60 while learning the mechanic |
First curl to a scaled-to-zero service looks fast | Without time, the cold-start gap is invisible in the response body | Prefix every cold-start curl with time to make the 10-15s gap visible |
git clone --depth 1 then vpa-up.sh fails with fatal: invalid reference | vpa-up.sh runs git switch --detach <tag> which needs full git history | Re-clone without --depth 1 |
vpa-down.sh "succeeds" but VPA CRDs remain | Cleanup script uses deprecated apiextensions.k8s.io/v1beta1 | Delete CRDs manually: kubectl delete crd verticalpodautoscalers.autoscaling.k8s.io verticalpodautoscalercheckpoints.autoscaling.k8s.io |
A general teaching pattern that prevents most of the above: run three terminals during any autoscaling demo. One for kubectl get pods -w, one for kubectl get hpa -w (or kubectl get scaledobject -w), one for triggering load. You catch every transition in real time instead of running a command, missing the moment, and re-running.
Visual Reference
Before the exercises, here's the entire lesson on one page. Sixteen panels, each one mapping to a section you've already read. Use it during the exercises as a quick anchor, and keep it as a study sheet for production debugging.
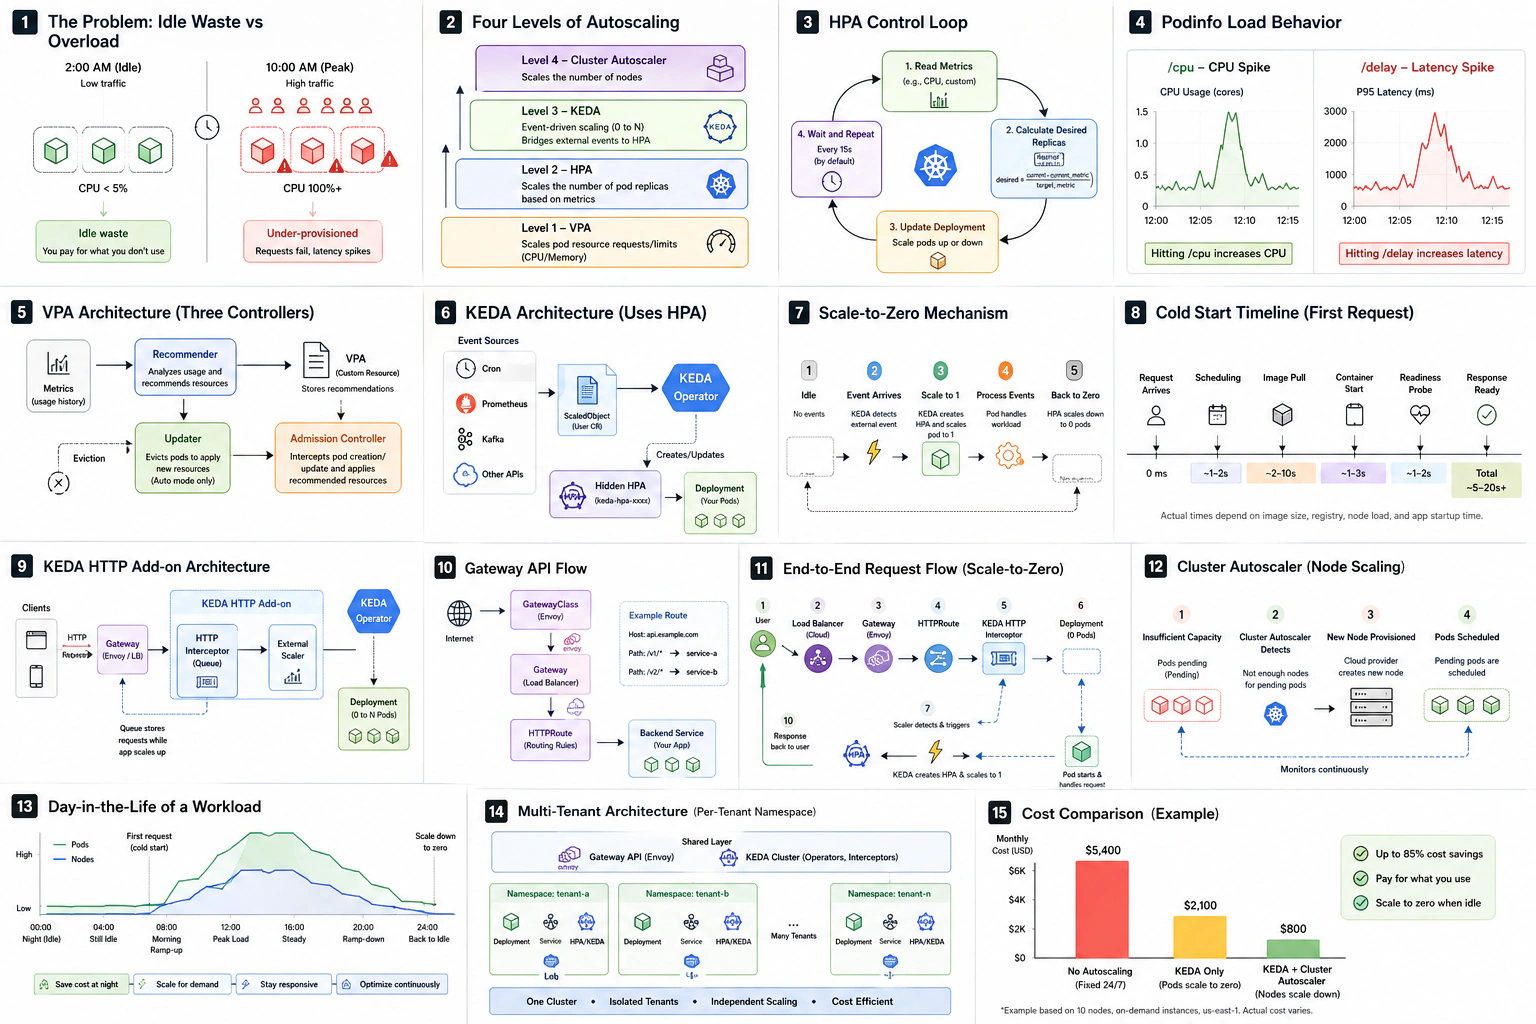
If a panel doesn't make sense yet, jump back to the matching section in the lesson — every box on the page has a written counterpart above.
Exercises
Exercise 1: HPA on CPU with a tuned behavior block
Deploy a simple service. Configure HPA with min: 2, max: 5, target: 60% CPU, and a behavior block that scales up by 100% per 15s and down by 25% per 60s with a 300s stabilization window. Generate load and confirm:
- TARGETS climbs above 60% before scale-up.
- REPLICAS doubles roughly every 15 seconds during the spike.
- After load stops, REPLICAS holds for roughly 5 to 6 minutes before dropping.
Don't panic if the drop takes a few seconds longer than 5 minutes. The 300s stabilization window is measured from "all observations within the window were below threshold," and metrics-server samples on its own cadence (~15s by default). The compounded sampling lag pushes the observed scale-down to ~5–6 min in practice. Your HPA is fine.
Exercise 2: Multi-metric HPA
Modify the HPA from Exercise 1 to scale on both CPU (70%) and memory (80%). Use kubectl top pods while running load to see which metric drives scale-up. Document which metric "wins" and why.
Exercise 3: KEDA cron scaler
Apply the hello-cron ScaledObject from earlier in this lesson. Watch the pod appear and disappear on schedule for 10 minutes. Inspect the hidden HPA with kubectl get hpa while the pod is up, and confirm that after the pod scales to zero the HPA stays visible with REPLICAS: 0 and <unknown> targets — KEDA bypasses the HPA, it does not delete it. Modify the cron expression to scale up for 1 minute every 3 minutes instead of 2 minutes every 5.
Exercise 4: KEDA Prometheus scaler
Deploy a service that exposes http_requests_total to Prometheus. Apply a ScaledObject that scales 1 to 10 based on sum(rate(http_requests_total[1m])) with threshold 50. Use hey or wrk to drive load and confirm replicas track the rate. Change the metric to p95 latency and observe how the scaling behavior changes.
Exercise 5: KEDA HTTP scale-to-zero
Deploy any HTTP service at replicas: 0. Apply an HTTPScaledObject with min: 0, max: 3. Send a request via port-forward (no Gateway needed for the demo). Measure the cold-start time. Send a second request and confirm it's fast. Wait 5+ minutes and confirm the pod terminates.
Exercise 6: VPA recommendations
Deploy a service with deliberately oversized requests (cpu: 1000m, memory: 2Gi). Apply a VPA in Off mode. After 30 minutes of light load, read the recommendation. By how much is your deployment over-provisioned? Apply the recommendation by editing the Deployment and observe the rollout.
Exercise 7: Wire it all together
Deploy a chatbot service at replicas: 0. Set up Envoy Gateway and an HTTPRoute that points to the KEDA HTTP interceptor. Send a request via the Gateway's external IP and confirm the cold-start path works end-to-end. Add Cluster Autoscaler to your node pool and induce a node-provisioning cold-start by deleting all worker nodes' pods and immediately sending traffic.
Try With AI
Prompt 1 — Decision logic
Given these workload types, recommend HPA, VPA, KEDA, Cluster Autoscaler, or
a combination, and justify each choice. Be specific about min/max replicas,
update modes, and which metrics or triggers you'd use:

1. A Postgres database
2. A FastAPI backend behind WhatsApp webhooks
3. A batch worker consuming from Kafka
4. A nightly report generator that runs once at 2 AM
5. A web frontend that serves consistent traffic 9–5 weekdays
6. A shared embeddings service used by 50 tenant chatbots
7. A long-running fine-tuning job that runs for 6 hours
What you're learning: the AI generates a stack per workload. Verify each choice against the four-level mental model. Did it correctly use HPA for the shared embeddings service and KEDA for the per-tenant chatbots? Did it leave the database alone? Did it pair scale-to-zero with Cluster Autoscaler?
Prompt 2 — Cold-start debugging
My HTTP-scaled service takes 25 seconds for the first request after
scale-to-zero. Walk me through the diagnostic steps to identify which phase
is slow: pod scheduling, image pull, container start, app startup, or
readiness probe. For each phase, suggest a specific kubectl command, log,
or metric to check, and a concrete fix if that phase is the bottleneck.
What you're learning: cold-start is additive across phases; a single 25-second number tells you nothing without decomposition. The AI should give you a phase-by-phase debugging recipe.
Prompt 3 — Per-tenant architecture
I'm running an AI assistant service for 100 customers, each needing their
own chatbot pod with isolated WhatsApp state. Design the Kubernetes
architecture: namespaces, KEDA configuration, Gateway routing, autoscaler
limits, cost controls. Make trade-offs explicit (cold-start vs cost,
isolation vs simplicity, Cluster Autoscaler vs Karpenter). Estimate the
monthly bill on DOKS at 10% concurrent active.
What you're learning: there is no single right answer. The AI's design will reveal what trade-offs it considers important. Push back on choices that don't fit your business reality (e.g., if it picks min: 1 per tenant, ask why and whether min: 0 with a longer scaledownPeriod would be cheaper).
Reflect on Your Skill
Open your traffic-engineer skill (create one if you don't have it). It should encode:
- The four-level mental model (HPA, VPA, KEDA, Cluster Autoscaler) with each one's hard limits.
- HPA template with a
behaviorblock for fast scale-up and gradual scale-down, including the missing-requests footgun. - KEDA ScaledObject template parameterized by trigger type (cron, prometheus, kafka).
- HTTPScaledObject template with
replicas,scaledownPeriod, andscalingMetric.requestRate. - Gateway + HTTPRoute template for routing through the KEDA interceptor.
- Decision tree from this lesson, verbatim.
- Cold-start diagnostic checklist (which phase, which command).
- "When NOT to scale to zero" list for safety.
A skill that knows only HPA but not KEDA, or only ScaledObject but not HTTPScaledObject, will be wrong on most AI workloads. A skill that knows KEDA but doesn't pair it with Cluster Autoscaler will scale your pods but not your bill. Make sure all four levels are encoded.
Safety Notes
- Test scale-to-zero in staging before production. Cold-start latency interacts with caller timeouts in non-obvious ways. WhatsApp webhooks retry with backoff, but many internal systems do not.
- Don't scale stateful workloads. Databases, message brokers, OpenClaw and similar runtimes need
minReplicaCount: 1. - Monitor cold-start latency over time. Image bloat, dependency drift, and node provisioning issues can quietly extend cold-start from 10 seconds to 60.
- HPA + VPA on the same resource is a known footgun. Use VPA in
Offmode unless you know exactly what you're doing. - Cluster Autoscaler has a minimum. Even at zero pods, your control plane and minimum node will cost something. Budget for it.
- Karpenter is AWS-strong, less mature elsewhere. On AKS use Node Auto-Provisioning, on GKE use Auto Provisioning, on DOKS stick with Cluster Autoscaler for now.