AI-Native 财务目录:AI 公司的定价、预测与财务架构
如果你刚接触这一切,请从这里开始
这是一份很长的文档。你不需要读完整篇才能开始使用。如果你刚接触财务,或者正在经营一家早期 AI 公司,下面就是对「我该做什么?」这个问题最简单的答案。
本周。 配好 Stripe(或同类工具)来处理计费。把它接到一个简单的记账工具上,例如 Pilot、Bench、Puzzle、Mercury Treasury,或任何能自动化基础工作的类似工具。从现在开始追踪三个数字:收入、毛利率(收入减去算力成本以及其他按使用量计费的供应商成本)和以月为单位的现金 runway。
本月。 建一个简单的电子表格,按月列出未来 18 个月,并向前预测同样三个数字。每个月第一个工作日更新一次。每月比较实际值和预测值。差异就是你理解业务真实运转方式的入口。
本季度。 有了三个月收入数据后,看平均毛利率。如果低于 50%,你的单位经济很可能已经失衡。多数 AI-native 业务需要 60%+ 的毛利率才能在规模化后活下来,而 SaaS 常规预期是 75–85%。低于 50% 是一个信号,说明要检查算力成本、供应商定价,或者你的定价模型是否适配成本结构。
今年。 不要雇 CFO。不要雇会计团队。不要购买企业级 FP&A 软件。除非投资人明确要求,否则不要做审计。把省下的时间用来增长收入,因为大多数财务工作只有在你已经有值得管理的实质性收入后才真正重要。
这就是 AI-native 公司前 12 个月的完整处方:Stripe + 一个记账工具 + 三个数字 + 一张简单的预测表。本文其余部分是为你超出这套配置之后准备的:当收入模型足够复杂、投资人要求足够高,或团队规模大到简单 stack 无法继续扩张时,再使用它。
如果你想在回到上面的处方前先看一个稍宽的概览,下面的「初学者 10 分钟版本」会给出更大的地图。
初学者如何阅读这份文档
如果你是真正的初学者,不要线性阅读本文。这个目录面向很多读者:创始人、CFO、controller、投资人;其中大部分内容暂时还不属于你。按顺序阅读下面五节;在你有真实收入之前,其他内容都可以先跳过:
- 如果你刚接触这一切,请从这里开始(上文):第一年的直接处方。
- 初学者 10 分钟版本(下文):更大的图景:四个家族、十二种 approach,每种用一句话说明。
- Approach 2 — Per-Call / Usage Pricing(Section A):最常见的 AI 定价模型,也是你最可能先运行的模型。
- Approach 7 — Compute COGS Accounting(Section B):每位创始人都必须理解 AI 业务毛利率的地方。
- Appendix A — Glossary(文末):遇到陌生术语时打开它。
这就是完整的 beginner reading path。五节加起来大约 4000 words。在你有具体问题前,可以跳过 executive summary、finance diagnostic、strategic fit matrix、另外十种 approach、cross-cutting concepts、AI-era shifts、common failures 和 anti-patterns。
当你已经有实质性收入后(通常是 $1M+ ARR),再回到本文,并按任何你感兴趣的顺序阅读其余部分。
这份文档放在哪里
这份文档属于 《AI-Native Company》系列。《Agent Factory 论纲》 定义架构。《AI Worker 目录》 定义要构建什么。《销售目录》 和 《营销目录》 讲公司如何销售并创造需求。Finance Catalog 定义公司如何记账、给产品定价、预测未来,并向资助它的人报告。
本文回答的是一个运营问题:考虑到成本结构、定价模型和预测问题都与传统 SaaS 有显著差异,AI-native 公司到底该如何运行财务侧?
你可以单独阅读本文。文中少量指向 Sales Catalog 的交叉引用(其中介绍了 pricing motions)即使跳过,也不会影响主线论证。
如何阅读这份文档
这份文档是一件工具,不是一个故事。不同读者会以不同方式使用它。
如果你刚接触财务。 按上面的「初学者如何阅读这份文档」阅读。第一次不要试图读完整个目录,其中大部分内容暂时还不属于你。
如果你是正在经营早期 AI 公司的创始人。 使用下面的 Finance Diagnostic 和 Strategic Fit Matrix,找出哪些 pricing architectures 适合你的买方和阶段。阅读 Section A 中相关的 approaches。在你有值得预测的收入之前,先跳过更深的会计和预测章节。
如果你是 AI 公司的 CFO、controller 或 finance lead。 这份文档就是为你设计的。请从头读到尾。各 approach 的顺序从 pricing(最常见的入口)开始,经过 accounting mechanics、forecasting,最后到 external reporting。
如果你是投资人或董事会成员。 Investor & Board Reporting approach(Section D)以及文末附近的 Common finance failures 最直接相关。
关于术语的一点说明。 本文会使用 accounting、FP&A 和 SaaS finance 中的技术词汇。专业术语第一次出现时,通常会在附近用普通语言解释。Appendix A: Glossary 提供快速参考。下面的「你必须先了解的财务术语」会覆盖你最常遇到的十五个重要术语。
关于专业建议的说明。 本文提供战略框架和运营参考,不构成专业会计、税务、法律或财务建议。ASC 606 下的收入确认、训练成本资本化、审计处理、销售税和公司结构问题,都需要合格专业人士结合你的具体情况给出建议。重大决策请聘请合格专业人士;本目录是对话起点,不是替代品。
关于置信度标注的说明。 文中一些 benchmark claims 和数值范围会带有标签,用来提示读者对具体数字应有多大信心。[Industry benchmark] 代表从业者广泛共识,并在 SaaS finance 文献中被反复引用(LTV/CAC > 3;成熟 SaaS 毛利率 75–85%;Burn Multiple 低于 1.5× 是健康 SaaS 标准)。[Emerging pattern] 代表 2024–2026 年在多家 AI-native 公司中观察到的模式,但还没有被规范参考资料完全固化(AI-native 毛利率 50–70%;compute 占收入 20–60%;foundation-model 价格每年下降 30–60%)。[Author thesis] 代表基于观察模式做出的推断,读者应把它视为一种观点,而不是定论(worker cards 中的特定 cost-per-outcome 范围、各阶段员工生产率 benchmark、按 modality 划分的 compute cost 范围)。未标注的数值主张位于这个谱系中的某处;标注是选择性的,不是穷尽性的。
初学者 10 分钟版本
如果你只有十分钟,就读这一节。它会让你理解 AI-native 公司如何处理财务,而不需要进入本文其余部分的深度。
什么是「AI-native finance」,它和普通 SaaS finance 有什么不同?
AI-native finance 是为使用基础模型、AI agent 或其他 compute-intensive AI workloads 的公司进行定价、会计、预测和报告的实践。它和传统 SaaS finance 有三个重要区别。第一,成本结构:传统 SaaS 因为托管成本相对收入很小,毛利率通常有 75–85% [Industry benchmark];AI-native 公司通常只有 50–70% 毛利率,因为 compute 是成本中的重要部分 [Emerging pattern]。第二,定价模型:传统 SaaS 卖 per-seat subscriptions;AI-native 公司经常使用 per-call、per-token、per-outcome 或 hybrid pricing,因为服务成本会随使用量变化。第三,预测复杂度:传统 SaaS 预测可以假设单位成本稳定;AI-native 预测必须考虑 foundation-model 价格每年下降 30–60% [Emerging pattern]、由使用量而不是 seat 驱动的客户 ramp curves,以及会以不同方式确认收入的合同结构。
财务 approaches 的四个家族
本文把十二种 approach 分成四个家族:
- Pricing architectures(1–5)。 AI 公司如何向客户收费。例子包括 per-seat(传统)、per-call(AI infrastructure 标准)、per-outcome(service-as-software)、value-based(按已衡量客户价值的一定比例收费)或 hybrid combinations。
- Revenue & cost mechanics(6–8)。 AI 公司如何核算收入和支出。例子包括 usage-based contracts 的 revenue recognition、compute COGS 处理、带 model-cost decay 的 cohort analysis。
- Planning & capital allocation(9–11)。 AI 公司如何预测和预算。例子包括 pilot-economics modeling、在 compute costs 下降背景下的收入预测,以及 compute 和 people 之间的资本分配。
- External reporting(12)。 AI 公司如何与投资人、董事会和审计师沟通。例子包括 investor metrics、board dashboards 和 audit-defensible disclosures。
十二种 approach,各用一句话概括
- Per-Seat Pricing。 按每位用户收取固定月费;它来自传统 SaaS,但对 compute costs 可变的 AI 产品越来越不合适。
- Per-Call / Usage Pricing。 按 API call、token 或 query 收费;这是 AI infrastructure 的主导定价模型,也是 AI 产品最常见的起点。
- Per-Outcome Pricing。 只有当 AI 交付一个定义明确的结果时才收费:一个 resolved support ticket、一笔 processed claim、一次 booked meeting。
- Value-Based Pricing。 按已衡量客户价值的一定比例收费;只适合有成熟买方的战略性 enterprise deals。
- Hybrid Pricing。 组合多种架构:base subscription 加 usage overages,或 subscription 加 outcome bonuses。
- Revenue Recognition for AI Contracts。 决定收入何时进入账本的会计规则(ASC 606);usage-based 和 outcome-based contracts 会让它更复杂。
- Compute COGS Accounting。 在 income statement 上如何处理 foundation-model API calls、GPU rentals 和 infrastructure compute 的成本。
- Cohort Analysis with Model-Cost Decay。 随着 foundation-model costs 下降,追踪 customer cohorts 如何随时间变得更赚钱。
- Pilot Economics & Contract Mechanics。 核算 paid pilots、扩张到 production contracts,以及多数 enterprise AI deals 所使用的多阶段商业结构。
- Revenue Forecasting Under Falling Compute Costs。 构建 12–24 个月收入和毛利率预测,并明确建模每年 30–60% 的 compute price reductions。
- Capital Allocation。 决定 incremental dollars 如何在 compute、people、marketing 和 runway 之间分配。
- Investor & Board Reporting。 设计 AI-native 投资人和董事会期待的 metrics、dashboards 和 disclosures;这些与传统 SaaS norms 有明显不同。
每种 approach 的初学难度
- Easy(直观、常见起点):Per-Seat Pricing(1)、Per-Call Pricing(2)
- Medium(需要运营纪律):Per-Outcome Pricing(3)、Hybrid Pricing(5)、Revenue Recognition(6)、Compute COGS(7)、Pilot Economics(9)、Capital Allocation(11)、Investor Reporting(12)
- Advanced(需要成熟财务职能或外部顾问):Value-Based Pricing(4)、Cohort Analysis(8)、Forecasting Under Falling Costs(10)
这就是十分钟内能读完的整份文档。其余部分会详细解释每一块,并给你工具来选择、排序和运行自己 AI 公司的财务架构。
你必须先了解的财务术语
如果财务对你还很陌生,下面是本文最常出现的十五个术语。理解它们后,你就能阅读后文而不必频繁查术语表。(文末 Appendix A 中有覆盖本目录 50 多个术语的完整 glossary。)
Revenue。 公司从客户那里赚到的钱。它是 income statement 的 top line。
Bookings。 某一时期内签下 deals 的总合同价值。它不同于 revenue:一份 $1.2M 的一年期合同在签署当天是 $1.2M bookings,但会在合同期内每月产生 $100K revenue。
Recognized revenue。 在 GAAP 规则下,某一期间进入 income statement 的合同收入部分。对传统 subscription contracts,recognized revenue 是 bookings 除以合同期限;对 AI-native 的 usage-based 和 outcome-based contracts,两者会明显分离。
ARR(Annual Recurring Revenue)。 subscription customers 的年化合同价值。它是最常被追踪的 SaaS 指标。一个按 annual contract 每月支付 $10K 的客户,会贡献 $120K ARR。
COGS(Cost of Goods Sold)。 向客户交付产品的直接成本。对 AI-native 公司,COGS 包括 foundation-model API costs、hosting 和 infrastructure,以及交付服务所需的可变 customer-success 时间。Compute 通常是最大的 line item。
Gross margin。 Revenue 减去 COGS,并以收入百分比表示。它是最重要的盈利能力指标。传统 SaaS norms 是 75–85%;AI-native norms 是 50–70%,因为 compute 是成本中的重要部分。
NRR(Net Revenue Retention)。 来自 existing customers 的 recurring revenue 保留比例,包含 upsell。高于 100% 表示现有客户群的收入在增长。130% NRR 意味着一年前同一批客户贡献的 $1M revenue,现在变成 $1.3M。
CAC(Customer Acquisition Cost)。 获取一个新客户的 fully-loaded cost,包括 sales spend、marketing spend,以及任何参与获客的其他职能成本。
LTV(Lifetime Value)。 一个客户在其整个客户生命周期中预计贡献的总 gross-margin contribution。
LTV/CAC ratio。 Lifetime value 除以 acquisition cost。健康 SaaS programs 的目标通常高于 3×。
CAC payback period。 客户的 gross-margin contribution 偿还获客成本所需的月份数。成熟 SaaS 的目标通常低于 18 个月。
Cash runway。 公司按当前 burn rate 维持运营、直到现金耗尽前还能撑多少个月。这是早期公司最基础的财务指标。
Burn rate。 公司每月流出的净现金,通常是 operating expenses 减去 collected revenue。一家公司每月支出 $500K、收款 $200K,则 burn rate 是 $300K/month。
Burn Multiple。 同一时期内 cash burned 除以 net new ARR added。越低越好;AI-native 低于 2× 属于健康,成熟 SaaS 低于 1.5× 属于健康。该指标由 David Sacks 推广。
Compute COGS。 运行 AI workloads 的成本:foundation-model API calls、GPU inference、infrastructure compute。在 AI-native 公司中,它作为 COGS 中的核心 line 处理,通常占收入 20–60%。
ASC 606。 美国收入确认会计准则。它决定收入何时进入账本,对有 usage-based 和 outcome-based contracts 的 AI-native 公司尤其重要。国际等价准则是 IFRS 15。
这十五个术语会在本文中出现数百次。其他词汇(variable consideration、deferred revenue、contribution margin、capital efficiency ratio、Rule of 40、audit defensibility)都建立在它们之上。如果你理解了上面的十五个,就能读懂本文其余部分。
AI-native 公司最少要追踪的财务指标
如果你只追踪十个指标,就追踪这些。下表是一家任意阶段 AI-native 公司最简单的 scorecard:它列出决定业务是否可行的指标、计算公式,以及你应当瞄准的目标。Section E 和 Section F 会给出完整指标集;这张表是地板,不是天花板。
| # | Metric | Formula | Why it matters | Target |
|---|---|---|---|---|
| 1 | Revenue(已确认) | 按 GAAP 规则在该期间赚取的 revenue 总和 | top line;income statement 报告的内容 | 月环比增长 |
| 2 | ARR | subscription contracts 的 annualized recurring revenue | 标准 SaaS scale metric | 取决于阶段 |
| 3 | Gross margin | (Revenue − COGS) / Revenue | unit economics 是否成立 | AI-native 为 50–70%,成熟 SaaS 为 75–85% |
| 4 | Compute as % of revenue | Compute COGS / Revenue | AI 特有的成本比例 | scaling stage 为 20–35% |
| 5 | Cash on hand | 期末 liquid cash 总额 | 生存指标 | 至少 18 个月 runway |
| 6 | Monthly burn | Operating expenses − revenue collected | 现金流出速度 | 取决于阶段 |
| 7 | Cash runway | Cash on hand / Monthly burn | 还能支撑多久 | 18+ 个月 |
| 8 | NRR | (Starting ARR + Expansion − Churn − Contraction) / Starting ARR | existing customer health | >110% 健康,>130% 强 |
| 9 | CAC payback period | CAC / (Monthly recurring revenue per customer × Gross margin) | acquisition 多久回本 | <18 months |
| 10 | Burn Multiple | Net cash burned / Net new ARR added | growth phase 的 capital efficiency | AI-native <2×,成熟 SaaS <1.5× |
每周追踪 cash 和 runway;每月追踪 revenue、ARR、gross margin、compute %、NRR 和 burn;每季度追踪 CAC payback 和 Burn Multiple。从你的记账工具中更新这些指标;不要维护一张和账本背离的 spreadsheet。
如果你持续追踪这十个指标,就具备了判断业务是否健康的运营纪律,也具备了和投资人对话的可信度。本文其他内容都是补充深度。
执行摘要
AI-Native Finance Catalog 是一本 recipe book,用于处理 2026 年及以后 AI-native 公司的财务侧。AI 业务有很多种定价、核算、预测和报告方式;正确方式取决于你的买方、阶段、合同结构和投资人预期。本文命名十二种 approach,把它们组织成四个家族,并告诉你哪些适合你的情况。
四个家族:每类 approach 的用途。
Pricing architectures(Approaches 1–5)定义公司如何向客户收费。这个选择会层层影响其他一切:revenue recognition、forecast complexity、sales-team compensation、customer-success focus。多数公司从一种 architecture 开始,并在规模化过程中演化为 hybrid。
Revenue & cost mechanics(Approaches 6–8)定义公司如何核算赚到的钱和花出去的钱。财务的技术工作在这里:把客户活动转成可审计的账本,正确分类 compute costs,并保持 cohort discipline,让 unit-economics truth 浮出水面。
Planning & capital allocation(Approaches 9–11)定义公司如何向前看。预测 AI 业务不仅要建模 revenue ramp,还要建模不断下降的 compute costs、扩张中的 usage,以及 AI capability 变化所带来的 customer behavior changes。Capital allocation 决定 dollars 如何在公司的三大成本中心之间分配:compute、people 和 customer acquisition。
External reporting(Approach 12)定义公司如何与投资人、董事会和审计师沟通。AI-native 公司会报告传统 SaaS 不需要的 metrics:model cost as percentage of revenue、gross margin including compute、contribution margin per outcome,以及按 model-price decay 调整后的 forecast accuracy。
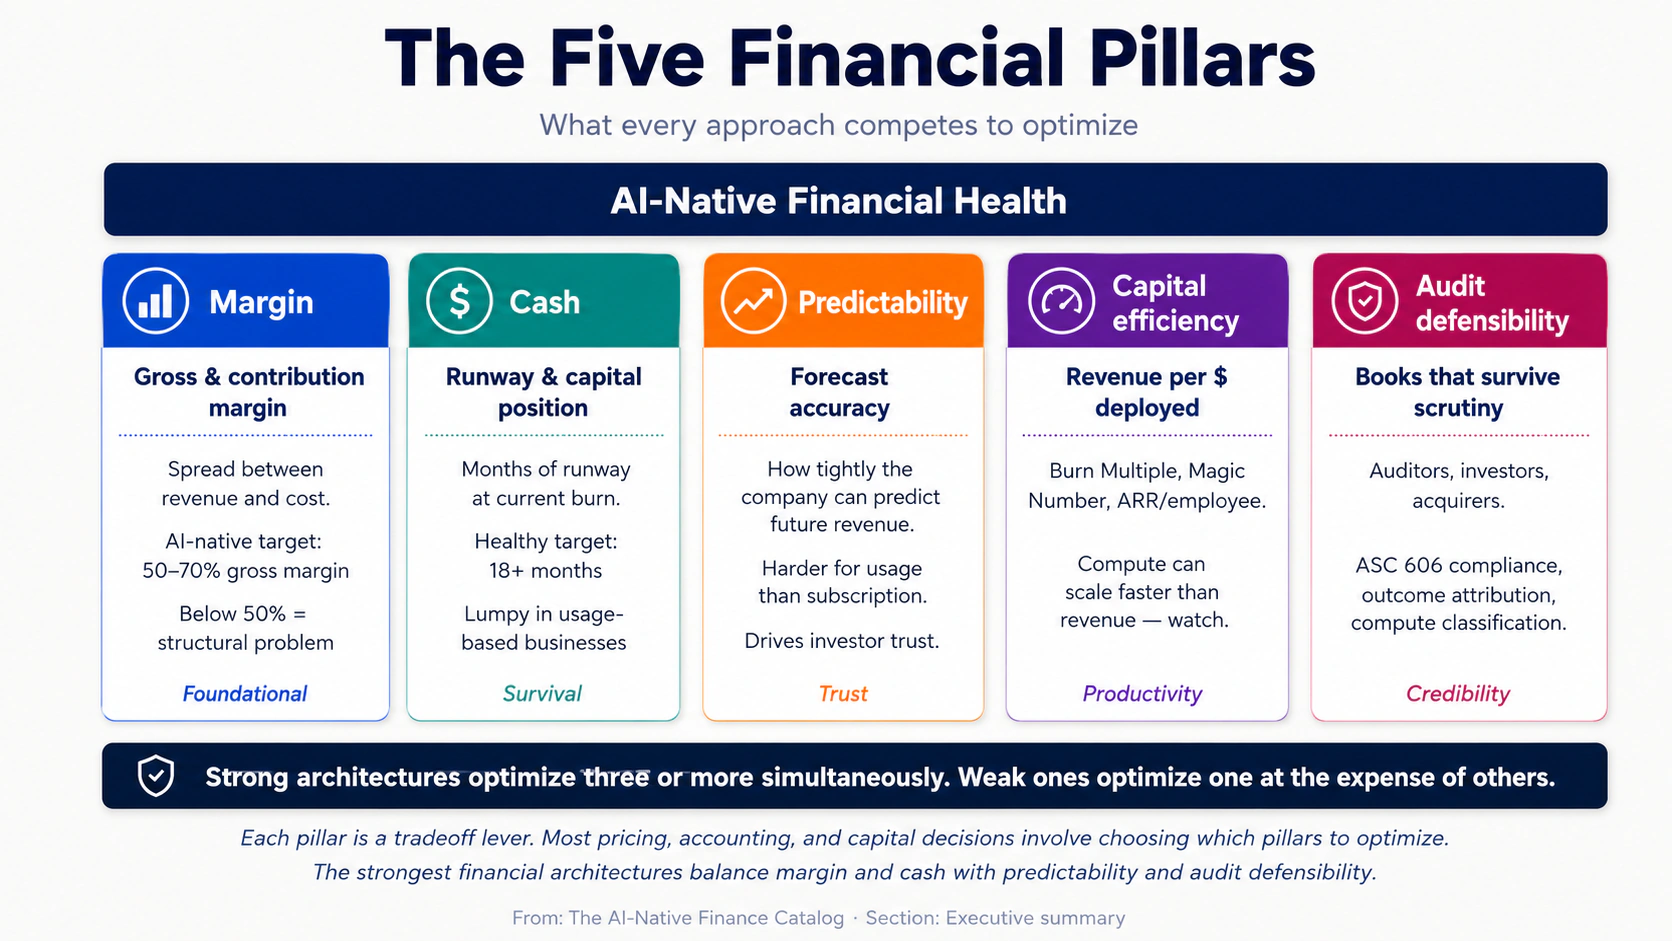
五个财务支柱:每种 approach 都在竞争优化什么。
Margin 是 revenue 和 cost 之间的差。Gross margin(收入减去 compute 和 direct costs)决定业务模型是否成立。AI-native 公司如果上线时毛利率低于 50%,很少能恢复;高于 70% 的公司则拥有实质 pricing power。
Cash 是决定 runway 的指标:公司有多少资本,以及按当前 burn rate 能撑多久。AI-native 公司经常出现 lumpy cash flows,因为 usage-based revenue 会随客户活动突然上升或收缩,也因为对 foundation-model providers 的 prepaid compute commitments。
Predictability 是预测准确度。传统 SaaS 因为 subscription revenue 可预测,所以能达到较高 forecast accuracy;AI-native 业务面临结构性 forecast uncertainty,来自 usage variance、model-price decay 和 outcome-attribution complexity。
Capital efficiency 是每投入一美元资本产生多少收入。Burn Multiple(burned capital 除以 net new ARR)和 Magic Number(sales efficiency)是常见 shorthand。AI-native 公司面临特别的效率挑战,因为 compute spend 可能比 revenue 更快扩张。
Audit defensibility 是账本经受审查的能力,包括年终审计中的 auditors、diligence 中的 investors,以及 M&A 中的 acquirers。AI-native 公司围绕 outcome attribution、usage-based revenue recognition,以及 model fine-tuning costs 的资本化还是费用化处理,面临新的 audit-defensibility 挑战。
最强的财务架构会同时优化三个或更多支柱。最弱的架构只优化一个支柱(通常是 margin 或 cash),并牺牲其他支柱;这会带来短期胜利和长期崩塌。
范围说明。 本目录主要关注从 seed 到 Series C 任意阶段的 B2B AI-native 公司。Consumer AI companies(拥有数百万免费用户、通过 tiered subscriptions 或 ads 变现的应用)遵循不同规则,不是本文的主要对象;不过 Per-Seat Pricing、Per-Call Pricing 和 Hybrid Pricing 等若干 approach 同时适用于两种语境。Late-stage public-company finance(IPO readiness、public-company reporting、segment disclosures)也不在本文范围内。
成熟度谱系。 每种 approach 都标记为 Proven、Emerging 或 Speculative,依据是今天有多少 AI-native 公司已经成功运行它。
- Proven approaches 已有许多 at-scale companies 在运行,并有成熟 playbooks 和 benchmarks。
- Emerging approaches 已在 2026 年的 AI-native 公司中运行,但会随底层 tooling 和 accounting standards 快速演化。
- Speculative approaches 依赖尚未大规模存在的实践或买方行为。
本页用于什么
本文有三个用途。
第一,作为选择器。 正在设计 AI 公司财务架构的创始人或 finance leader,可以使用 Strategic Fit Matrix、Finance Diagnostic 和 Approach Summary Table,找出适合自身阶段、买方和合同结构的架构。
第二,作为参考。 正在运行某个现有架构的 finance team,可以用深度章节审计自己的运营,对照文中模式比较 gross margin、cohort behavior 和 forecast accuracy。
第三,作为排序指南。 多数成功的 AI-native 公司会随着规模演化财务架构。Common Hybrid Models 一节映射了最常见的演进路径。
如何选择财务架构
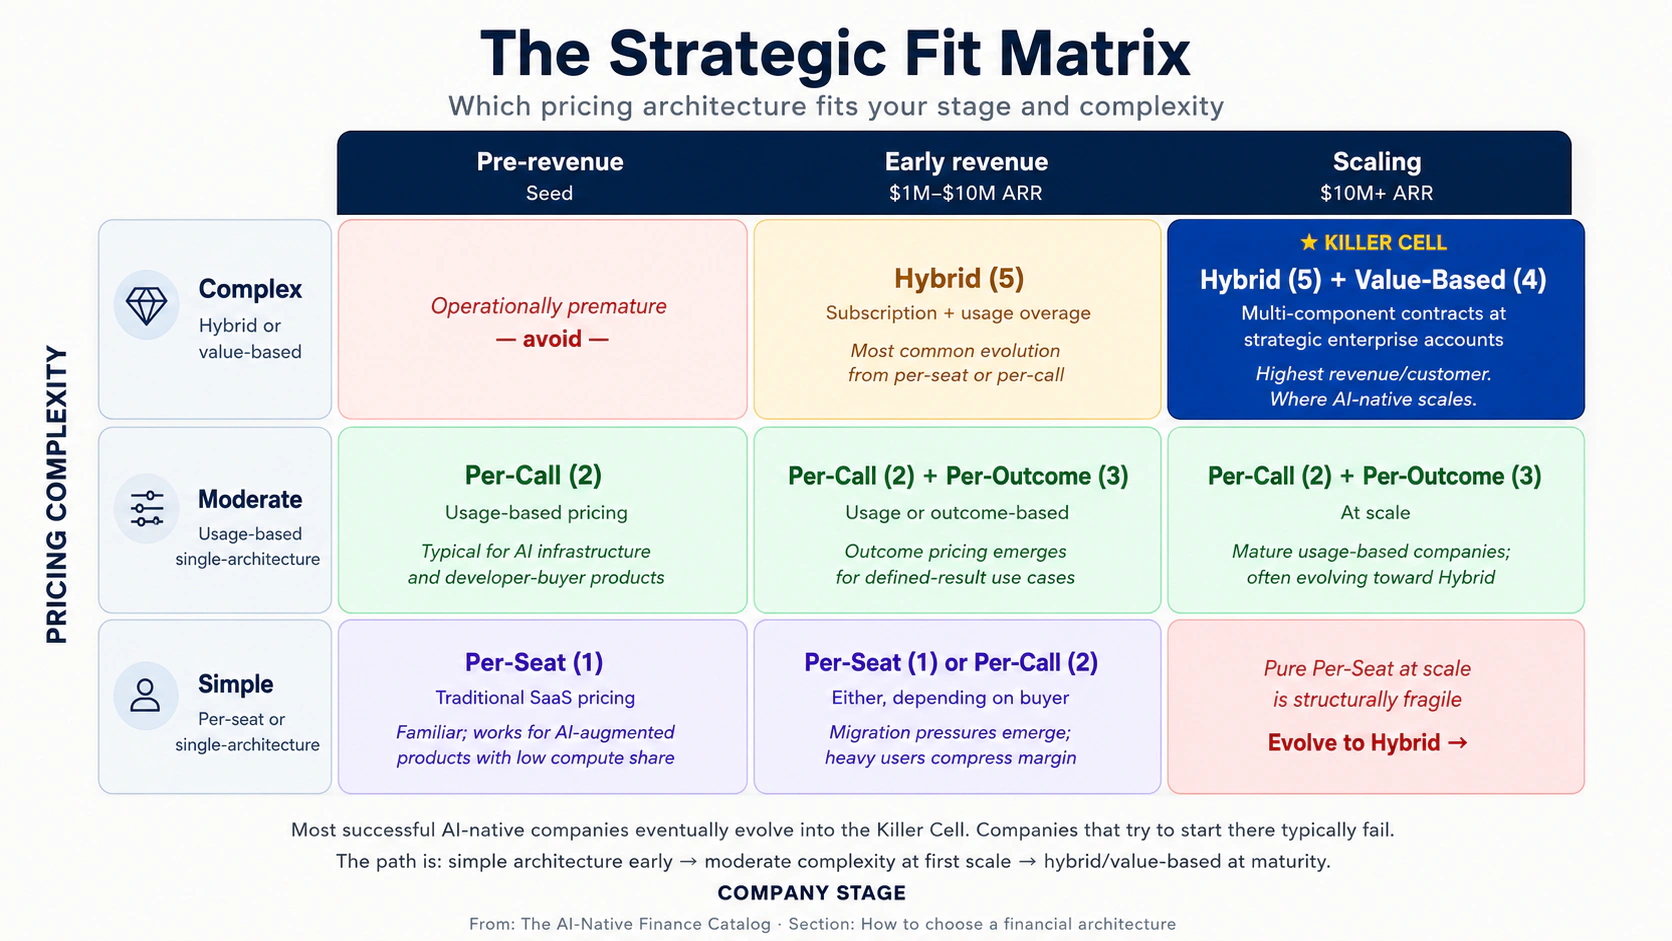
预测哪种财务架构适合你的最干净变量,是 pricing complexity 和 company stage 的交叉点。下方矩阵把十二种 approaches 映射到这两个轴上。
| Stage → / Pricing complexity ↓ | Pre-revenue (Seed) | Early revenue ($1M–$10M ARR) | Scaling ($10M+ ARR) |
|---|---|---|---|
| Simple(per-seat 或 single-architecture) | Per-Seat (1) | Per-Seat (1), Per-Call (2) | — |
| Moderate(usage-based,single-architecture) | Per-Call (2) | Per-Call (2), Per-Outcome (3) | Per-Call (2), Per-Outcome (3) |
| Complex(hybrid 或 value-based) | — | Hybrid (5) | Hybrid (5), Value-Based (4) |
最重要的格子是 complex × scaling:Hybrid Pricing 和 Value-Based Pricing。这些架构能产生最高的 revenue per customer 和最可防守的 pricing power,但需要成熟的 finance、sales 和 customer-success operations 才能执行。多数成功的 AI-native 公司最终会演化到这个格子;试图从一开始就进入这里的公司通常会失败,因为运营成熟度尚未具备。
财务诊断:八个问题
在选择财务架构前,先诚实评估下面八个维度。每一行指向的 approaches,是与该条件最匹配的选项。
-
Buyer type。 Developer / API consumer → Per-Call (2)。Operator buying SaaS → Per-Seat (1) 或 Hybrid (5)。Enterprise buyer with budget for outcomes → Per-Outcome (3) 或 Value-Based (4)。
-
Average deal size。 <$10K/year → Per-Seat 或 Per-Call。$10K–$100K → Per-Call 或 Hybrid。$100K+ → Per-Outcome、Value-Based 或 Hybrid。
-
Cost structure variability。 Compute cost 小且稳定 → Per-Seat 没问题。Compute cost 随使用量显著变化 → 需要 Per-Call。Compute cost 很显著,但 value-per-outcome 远高于成本 → 可以考虑 Per-Outcome。
-
Sales motion。 Self-serve PLG → Per-Call 或 Per-Seat。Vendor-led mid-market → Per-Seat、Per-Call 或 Hybrid。Enterprise field → Per-Outcome、Value-Based 或 Hybrid(见 Sales Catalog Motions 7–10)。
-
Customer technical sophistication。 高(developers、technical operators)→ Per-Call 可行;用户能接受可变账单。低(executive buyers、ops)→ Per-Seat 或 Hybrid;用户想要可预测账单。
-
Contract length。 Monthly self-serve → Per-Call 或 Per-Seat。Annual SaaS → 任意 architecture。Multi-year enterprise → Hybrid 或 Value-Based。
-
Forecast accuracy required。 紧(board-driven targets、public-company-style discipline)→ Per-Seat 或 Hybrid(更可预测)。松(early-stage、growth at all costs)→ Per-Call 或 Per-Outcome。
-
Internal finance maturity。 创始人用 spreadsheet 做账 → Per-Seat 或 Per-Call(会计最简单)。已有 controller → 可以考虑 Per-Outcome。完整 finance team → Value-Based 和复杂 Hybrid 可行。
这个 diagnostic 不会告诉你哪个 architecture 绝对正确。它告诉你基于起点哪些 architecture 是可用的。上面的矩阵和下面的深度章节,会告诉你在可用架构中哪一个适合你正在定价的买方。
Approach summary table
十二种 approach 的一页参考。
| # | Approach | Maturity | Best for | Main strength | Main risk |
|---|---|---|---|---|---|
| 1 | Per-Seat Pricing | Proven | Predictable-usage SaaS | Forecast simplicity | Disconnects price from cost |
| 2 | Per-Call / Usage Pricing | Proven | Developer-buyer infrastructure | Aligns price with cost | Customer bill anxiety |
| 3 | Per-Outcome Pricing | Emerging | Defined-result use cases | Maximum value capture | Outcome-attribution complexity |
| 4 | Value-Based Pricing | Emerging | Strategic enterprise deals | Premium pricing | Contracting maturity required |
| 5 | Hybrid Pricing | Proven | Mid-market and enterprise scale | Balance of predictability and capture | Complexity to communicate |
| 6 | Revenue Recognition | Proven | Any company with revenue | Audit defensibility | ASC 606 complexity for usage/outcome |
| 7 | Compute COGS Accounting | Proven | Any AI-native company | Margin clarity | Misclassification risk |
| 8 | Cohort Analysis with Model-Cost Decay | Emerging | Companies $5M+ ARR | Truth about unit economics | Requires data discipline |
| 9 | Pilot Economics & Contract Mechanics | Proven | Enterprise sales motions | Pilot-to-production conversion | Premature production accounting |
| 10 | Forecasting Under Falling Compute Costs | Emerging | Companies on usage models | Realistic margin trajectory | Over-optimism on compute decay |
| 11 | Capital Allocation | Proven | Any post-Series A | Strategic spend discipline | Compute over-investment |
| 12 | Investor & Board Reporting | Proven | Any post-Series A | Stakeholder alignment | Vanity metrics over substance |
我应该运行哪种 approach?
下面的 decision flowchart 按顺序排列最重要的问题,用来缩小架构选择范围。
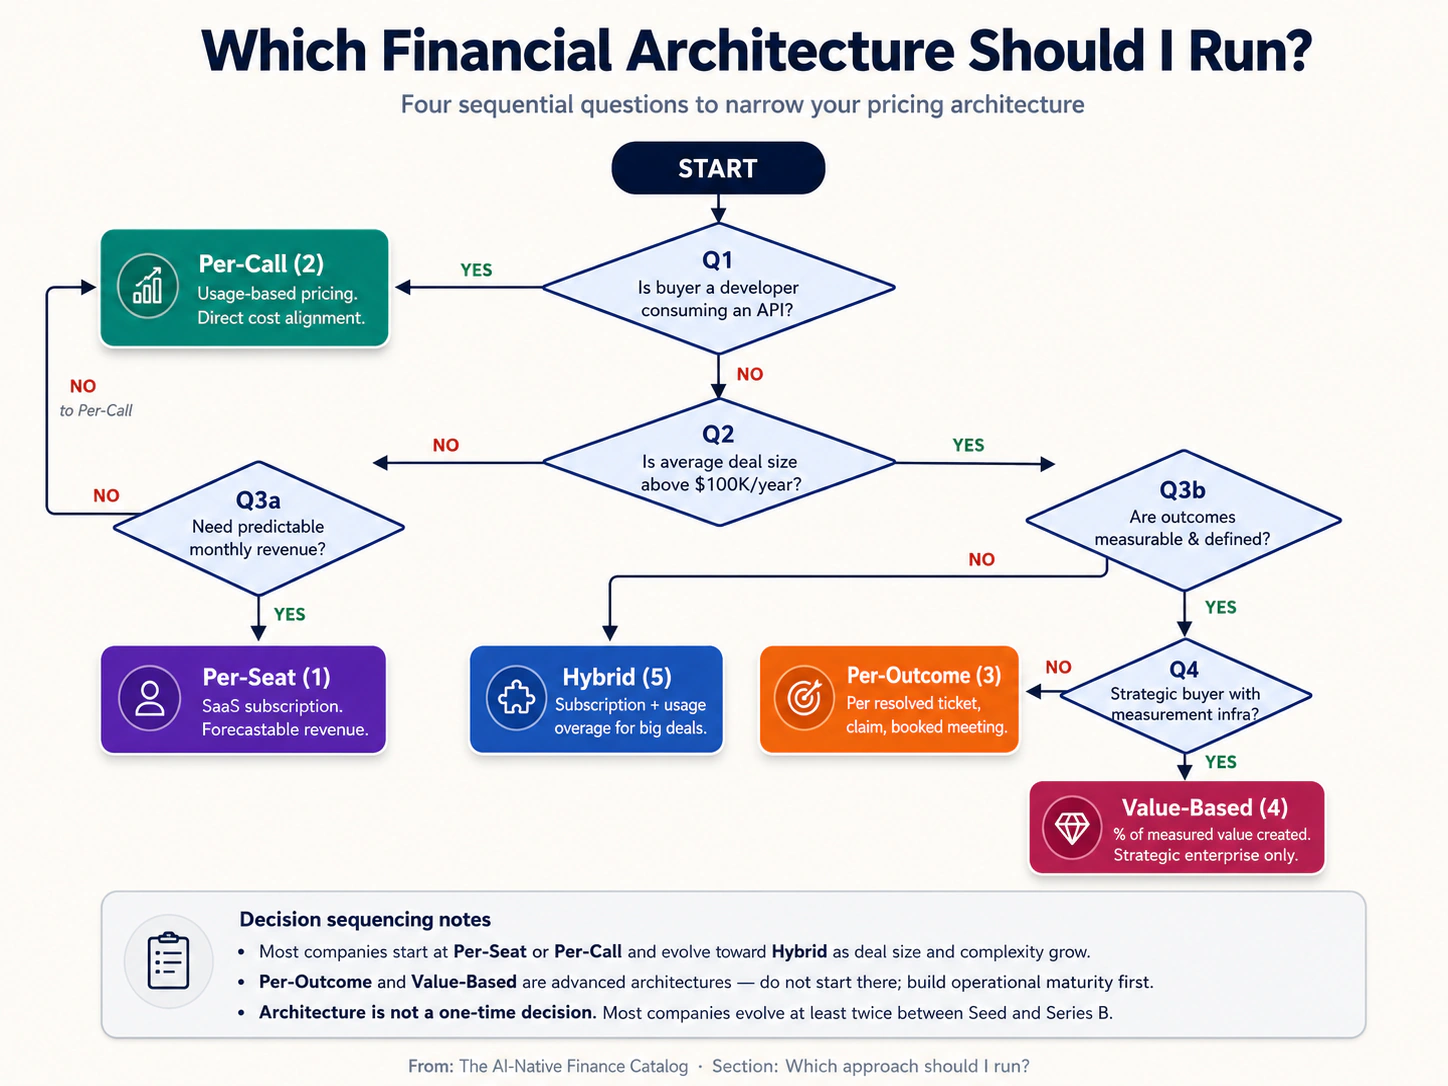
四个关键问题是:(1)你的买方是否是使用你 API 的 developer?(是 → Per-Call。)(2)你的 average deal size 是否高于 $100K?(是 → 考虑 Per-Outcome、Value-Based 或 Hybrid。)(3)你是否需要可预测收入来做 forecast?(是 → Per-Seat 或 Hybrid;否 → Per-Call 或 Per-Outcome。)(4)你的 finance team 的运营成熟度如何?(低 → 更简单的架构;高 → 复杂架构可行。)
财务成熟度曲线
每家 AI-native 公司都会经历三个财务成熟度阶段。适合每个阶段的 architecture 和 operating practices 都不同,试图在 stage 1 运行 stage-3 architecture,是创始人浪费资金最常见的方式之一。
三个阶段定义了 Financial Maturity Curve:
Stage 1 — Pre-revenue(Seed-stage)。 公司有产品,但收入有限。财务工作最少:追踪 burn、管理 runway、完成基础税务申报,并为第一次 audit-equivalent 做准备(通常是 Series A diligence 期间的 Quality of Earnings review)。正确 architecture 是最容易实现、最容易向早期客户解释的 pricing model,通常是 Per-Seat(1)或 Per-Call(2)。Finance team:创始人,加上 Pilot/Bench/Puzzle 等记账工具。
Stage 2 — Early revenue($1M–$10M ARR)。 公司已有 product-market fit signals 和有意义的客户数量。财务工作扩展到 monthly close、board reporting、基础 forecasting,以及第一批内部 cohort analyses。Pricing architectures 开始稳定,但团队会看到演化压力:enterprise customers 想要不同条款,customer-success metrics 要求 outcome thinking,投资人期待更清晰的 unit economics。正确 architecture 是能够产生清晰 cohort retention,同时会计复杂度可管理的 pricing model。Finance team:controller(全职或 fractional)、bookkeeper,创始人仍参与重大决策。
Stage 3 — Scaling($10M+ ARR)。 公司正在准备或已经完成 Series B。财务工作包括完整 FP&A、audit preparation、complex contract accounting,以及越来越成熟的 investor and board reporting。Hybrid Pricing(5)和 Value-Based Pricing(4)在运营上变得可行。带 model-cost decay 的 cohort analysis(Approach 8)成为 board-level metric。Capital allocation(Approach 11)成为核心战略问题。Finance team:VP Finance 或 CFO、controller、FP&A analyst(s),以及越来越专业化的角色(revenue operations、treasury)。
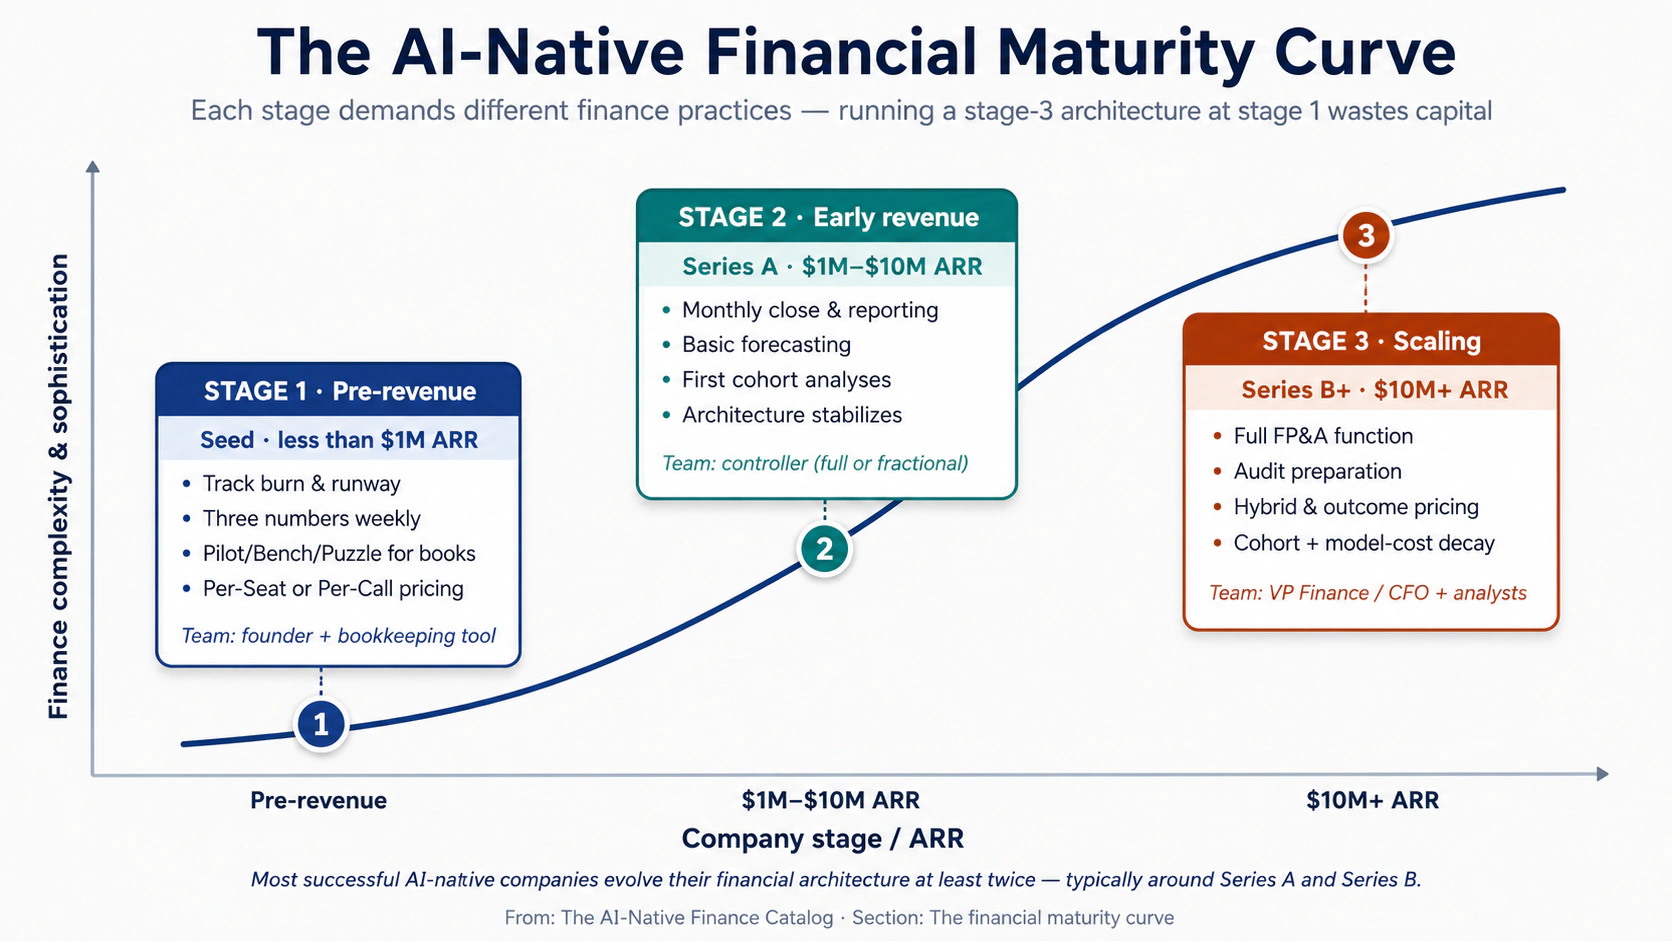
对创始人的含义是,financial architecture 不是一次性决策。今天适合你阶段的 architecture,很可能在公司达到规模前至少需要演化两次:通常一次在 Series A 前后(引入更成熟的 cohort discipline),一次在 Series B 前后(引入 hybrid pricing 或 outcome-based components)。锁定 stage-1 architecture 并试图不演化就规模化的公司,通常会在 high-single-digit-millions ARR 附近遇到天花板。
成熟度图例
- Proven。 该 approach 今天已有许多 AI-native(以及 pre-AI)公司在规模化运行,并有成熟 playbooks 和 benchmarks。
- Emerging。 该 approach 正在 2026 年的 AI-native 公司中运行,但变化很快,canonical playbook 尚未稳定。
- Speculative。 该 approach 依赖尚未大规模存在的实践或买方行为。
A. 定价架构
公司向客户收费的方式。Pricing architecture 是 AI-native 公司最重要的财务决策,因为它会层层影响 revenue recognition、sales-team compensation、customer-success focus、forecast complexity 和 gross-margin structure。多数公司从一种 architecture 开始,并在规模化过程中演化为 hybrid。
Approach 1 — Per-Seat Pricing
Maturity:Proven。Beginner difficulty:Easy。
白话解释。 Per-Seat Pricing 是每个人都在 2010 年代学过的 SaaS 模型:客户按每位用户、每月支付固定费用。10 个用户,每人 $50/month,就是 $500/month。客户账单可预测,公司收入可预测,会计也直接。唯一问题是客户需要多少 seats。
对 AI 产品来说,这个模型越来越别扭。AI compute costs 随使用量扩张,而不是随 seat count 扩张。一个有 10 个 seats 的客户可能产生一万次 AI calls,也可能产生一千万次;服务成本差几个数量级,但收入完全相同。真正 AI-heavy 的产品如果采用 Per-Seat Pricing,通常会发现最重度用户贡献的是负毛利。
最适合作为 AI-augmented SaaS 的起步架构:AI 只是多个功能中的一个。对 AI 是核心价值驱动的产品,这个模型越来越不合适。
核心想法。 按用户收取可预测费用,同时接受收入不会追踪使用量,并且 heavy users 可能产生负 unit economics。
适用场景。 当产品是 AI-augmented,而不是 AI-defined,也就是 AI 是更大 workflow 产品中的一个功能。当买方是需要可预测预算 line item 的 executive。当每个 seat 的底层 compute cost 足够小(低于 subscription revenue 的 10–15%),usage variability 不会威胁 gross margin。
机制。 Per-Seat Pricing 有效,是因为它给买方和卖方都提供 predictability。买方可以做预算,卖方可以做 forecast。Annual contracts 产生 contracted ARR(annual recurring revenue),这是过去十年 Wall Street 训练 AI 公司优化的指标。
AI 产品的结构性问题,是 price 和 cost 脱节。Foundation-model API pricing 是按单位计价的:per token、per second of audio、per image generation。当产品把这个 API 包在 per-seat subscription 后面时,用户每一次调用都是卖方吸收的成本。Heavy users 往往也是客户最投入的员工,这一点有些讽刺;他们产生最多 usage,也产生最多 cost。如果所有用户平均 compute cost 是 seat revenue 的 20%,最重度的十分之一用户可能产生等于其 seat revenue 80% 甚至更高的 compute costs,留下很薄的 margin,甚至负 contribution。
2026 年的修复方式很少是彻底放弃 Per-Seat Pricing;更常见的是在合同中加入 usage-based component,也就是 included quota 以上的 per-call 或 per-token overage。这会把纯 Per-Seat 转成 Hybrid Pricing(Approach 5),而这正是规模化 AI-native SaaS 中最常见的架构。
虚构 walkthrough。 想象 MeetingMind,一款 AI meeting-summary 工具,售价 $30/seat/month。一个 100-seat 客户每年支付 $36,000。在这 100 个用户中,20 个重度使用(每人每月 50+ summaries),60 个轻度使用(5–10 summaries),20 个不活跃。20 个 heavy users 每人每月产生 $25 compute costs(合计 $6,000/year);其余用户成本很小。总 compute 大约 $7,000/year,对应 $36,000 revenue,毛利率约 80%,很舒服。现在想象随着产品粘性增强,heavy-user share 上升到 50%。Compute costs 升至 $15,000+,毛利率降到 60%。卖方要么引入 overage pricing,要么眼看 margin 被侵蚀。
Example。 Confirmed pattern:多数 AI-augmented productivity tools(Notion AI、带 AI 的 Linear、Asana Intelligence)都为核心 SaaS 采用 Per-Seat Pricing,并经常加入 usage-tier limits 来限制 compute exposure。到 2026 年,在 heavy-AI products 中很少看到没有限制的纯 Per-Seat。
Primary risk。 heavy users 带来负 unit economics。最投入的用户也是服务成本最高的用户,但他们支付的价格和轻度用户一样。Mitigation:按 user cohort 监控 compute-per-seat,一旦 heavy-user share 超过阈值就引入 usage caps 或 overage pricing,并把 Hybrid Pricing(Approach 5)视为自然演进。
First move。 计算当前客户群的 average compute cost per seat。如果它超过 seat revenue 的 15%,就开始规划向 Hybrid Pricing 迁移。
Approach 2 — Per-Call / Usage Pricing
Maturity:Proven。Beginner difficulty:Easy。
白话解释。 Per-Call Pricing 是 AI infrastructure 的标准。客户按 API call、consumed token、processed audio second、generated image 或 executed query 付费。收入随使用量扩张,成本也随使用量扩张,两者直接对齐。OpenAI、Anthropic、ElevenLabs、Replicate 以及多数 AI infrastructure companies 都使用这个模型。
优点是 gross margin 在结构上受到保护:每次 call 的收入都高于其 compute cost,因此不管客户行为如何,公司都不会在单位层面亏钱。缺点是客户账单不可预测,这会在 customer success 和 renewal 中反复制造问题:每一次 usage spike 都会带来 bill spike,超过内部预算的客户会变成不满意客户。
最适合作为 AI infrastructure products 和 developer-buyer products 的 founding architecture。在 operator-buyer products 中,也常作为 Hybrid Pricing 的一个 component。
核心想法。 让 price 直接对齐 usage 和 cost。每次 call 都让公司承担某个 compute amount,因此按高于该成本的价格收费,并内置 margin。
适用场景。 当买方是适应 usage-based billing 的 developer 或 technical user。当产品确实 usage-variable,即不同客户消耗的量差异很大。当团队愿意投入 usage instrumentation、billing infrastructure,以及帮助买方管理账单的 customer-success work。
机制。 Per-Call Pricing 有效,是因为它在 architecture 层面解决了 gross-margin 问题。每次 call 的价格都高于成本,因此 margin 在数学上受到保护。Forecasting 比 Per-Seat 更难(revenue 取决于 usage,而 usage 取决于可变的 customer behavior),但对许多 AI infrastructure products 来说,用预测难度换取 margin safety 是值得的。
执行它需要三项传统 SaaS 不需要的运营纪律。Usage instrumentation:每个可计费事件都必须被测量、归因到正确客户,并存入可审计记录。Billing infrastructure:每月生成准确、可辩护的 invoice 比固定费用计费更难,错误会立刻被客户看见。围绕 bill management 的 customer success:客户需要 dashboards 监控 usage,需要 usage spikes 时的 alerts,也需要设置 caps 或 budgets 来避免惊喜账单。没有这三项纪律就上线 usage-based pricing 的公司,会看到客户 churn 来自 bill anxiety,而不是产品不满意。
规模化后的约束是 bill-shock。一个客户一月用了 $5K compute,二月用了 $50K,就会看到 10× bill increase,需要内部批准才能付款。默认反应「我们明年再评估」会转化成收入流失。成熟 usage-based 公司会大量投入 bill-prediction tools、capacity-planning conversations,以及当 usage trajectories 暗示 budget concerns 时的主动 outreach。
虚构 walkthrough。 想象 TextAI,一家 LLM API 公司。客户按每 1K input tokens 支付 $0.005,按每 1K output tokens 支付 $0.015。典型客户注册、构建 integration,前三个月每月试验成本 $200,然后部署到 production,并在接下来的六个月 ramp 到 $5,000/month。到第九个月,客户每天处理 50M tokens,每月支付 $150K。客户账单不可预测;他们的 CFO 每月都会抱怨;customer-success team 花 30% 时间帮他们 forecast。但 TextAI 对这个客户每个月的 gross margin 都稳定在 65%,因为无论客户如何 ramp,这个 architecture 都保护业务模型。
Example。 Confirmed examples:OpenAI、Anthropic、Cohere、Mistral、ElevenLabs、Replicate、Together AI、Fireworks AI,以及 AI infrastructure companies 的长尾。2026 年几乎每家 AI-API business 都使用某种 usage pricing。
Primary risk。 Bill-shock 和 customer churn。超出预算的客户会不开心,不管产品有多好。Mitigation:投入 usage dashboards、budget alerts、与大客户每月做 capacity-planning conversations,并提供让客户设置 hard caps on spend 的选项(同时接受 hitting the cap 会造成另一种痛苦:service interruption,也需要谨慎管理)。
Secondary risk。 Forecast unpredictability。Usage-based revenue 比 subscription revenue 更难预测,会使 fundraising、board reporting 和 operational planning 更复杂。Mitigation:建立 cohort-based forecast models,用过往 customer behavior 预测 usage growth;投入 lead indicators(calls per active user、active-user growth rate),这些比 total usage 更可预测。
First move。 如果你的产品确实 usage-variable,并且买方是 technical,就从一开始上线 Per-Call Pricing。设定一个 unit consumption price,使你获得 60%+ gross margin [Emerging pattern: 低于这一 AI-native floor 后,规模化会在结构上变困难],仔细 instrument usage,并在第一个客户到来前建好 usage dashboard。
Approach 3 — Per-Outcome Pricing
Maturity:Emerging。Beginner difficulty:Medium。
白话解释。 Per-Outcome Pricing 意味着客户只在 AI 交付定义明确的结果时付费。一次 resolved support ticket、一笔 processed insurance claim、一次 booked sales meeting、一个 successful completed agent task。客户不是为 access、time 或 compute 付费,而是为 outcomes 付费。如果 AI 没有交付,客户就不付费。
这个 pricing model 有时被称为「Service-as-Software」,是过去几年 AI commercial structure 中最具辨识度的创新。它运营复杂、会计负担重,并依赖公司准确归因 outcomes 的能力。但对 outcomes 可衡量的 use cases 来说,它会产生远高于 Per-Call 或 Per-Seat alternatives 的 per-customer revenue,因为价格锚定的是客户的 labor budget,而不是 software budget。
最适合 outcomes 定义清晰、可衡量且 AI 能稳定交付的 use cases。几乎总是与 Sales Catalog Motion 9(Pay-Per-Outcome)结合。运营复杂;需要大量 outcome-attribution infrastructure。
核心想法。 按 delivered outcome 收费,把价格锚定在客户的 labor cost 上,而不是卖方的软件成本上。
适用场景。 当 use case 有清晰、可衡量、可归因的 outcome。当客户的替代方案是雇人做同样工作(因此 comparison anchor 是 human labor cost)。当公司愿意投入 outcome-attribution infrastructure,这通常是运行该 architecture 早年里最大的一项非产品工程投入。
机制。 Per-Outcome Pricing 有效,是因为它让卖方捕获客户 labor budget 的一部分,而不是 software budget 的一部分。一家 mid-market 公司花在 customer-support headcount 上的钱,可能是 customer-support software 的十倍。通过 outcome pricing 捕获一部分 headcount budget 的 AI vendor,与只捕获一部分 software budget 的 vendor 不在同一个 revenue category。
定价数学锚定在人力成本上。如果一位 customer-support representative 解决一张 ticket 的 all-in cost 大约是 $5(salary、benefits、management overhead、workspace),outcome price ceiling 大约在每张 resolved ticket $1–3:足够低于人力成本,让客户获得真实节省;也足够高于卖方 compute cost,让 gross margin 为正。卖方每个 outcome 的 compute cost(优化良好的 agent 通常为 $0.20–0.80 [Author thesis: 基于 2026 年观察到的 deployments;对 model choice 和 prompt efficiency 敏感])设定 floor;客户的人力成本设定 ceiling;price 位于两者之间。
技术基础是 outcome attribution。Vendor 必须生成 audit-grade telemetry:对每个 priced outcome,都有可验证记录说明 AI 做了什么、处理了什么,以及结果如何被确认。没有这些,客户争议就没有客观依据,revenue collection 会变成季度性谈判。运行这个 architecture 很好的公司会把 outcome-attribution infrastructure 当成产品的一部分,而不是 accounting overhead,并用 engineers 而不是 finance analysts 来 staffing。
会计复杂度是真实的。Revenue 是随着 outcomes delivered 而确认的(不是合同签署时确认),这意味着 contract-to-revenue conversion 不是 1:1:公司签下 $1M bookings,但 revenue 只会随着 outcomes accrue 在很多个月内逐步确认。再叠加标准 ASC 606 要求(Approach 6),会产生传统 SaaS finance 不必管理的 deferred-revenue mechanic。
虚构 walkthrough。 想象 TicketBot,一个 AI customer-support agent。TicketBot 不按 seat 或 call 向客户收费,而是在每张 support ticket 由 TicketBot 独立解决(不升级给 human)时收取 $0.50。每月有 50,000 张 tickets 的客户会收到 $25,000 monthly bill,但前提是 TicketBot 真的解决了这些 tickets。如果 TicketBot 只解决 30% incoming tickets,账单就是 $7,500。客户 CFO 喜欢这个模型;客户 procurement team 需要学习如何构造合同;TicketBot 自己的 finance team 必须投入 outcome-attribution infrastructure 来支撑每个 billable event。
Example。 Confirmed examples:Sierra 对 AI customer service 的 per-resolution pricing。Decagon 的 outcome-based contracts。EvenUp 为 personal-injury legal work 使用 per-claim pricing。这个模式是 2026 年扩张最活跃的 pricing structures 之一,并且几乎都出现在同时运行 Sales Catalog Motion 9 的公司中。
Primary risk。 Outcome-attribution disputes。如果没有 audit-grade telemetry,客户会争议什么才算「resolved」outcome,collection 会变成谈判。Mitigation:把 attribution infrastructure 作为核心 engineering function 投入。在第一份合同之前就建好 telemetry,不要事后 retrofit。
Secondary risk。 Revenue recognition complexity。ASC 606 下的 outcome contracts 需要谨慎结构化,并可能产生令人意外的 deferred-revenue patterns。Mitigation:从第一份合同开始就与有 AI 经验的 revenue accountant 合作;不要假设传统 SaaS revenue recognition rules 适用。
First move。 定义一个清晰、不含歧义、可衡量、可归因的 outcome。第一份合同保守定价(靠近你的 cost floor,而不是 value ceiling),先学习运营 mechanics。至少经历六个月 attribution disputes 后,再逐步提高 price。
Approach 4 — Value-Based Pricing
Maturity:Emerging。Beginner difficulty:Advanced。
白话解释。 Value-Based Pricing 意味着客户按 AI 为其创造的已衡量业务价值的一定比例付费。一家 hedge fund 部署 AI 工具,每年提升 trading efficiency $40M;AI vendor 的合同按 measurable improvement 的 15% 结构化,每年支付 $6M。价格不锚定在卖方成本或可比软件上,而是锚定在客户已衡量的 outcomes 上。
这是 AI 中 revenue-per-customer 最高、也最少见的 pricing model。它需要成熟的 contracting、买方处的 executive sponsorship(通常是 C-suite),以及大量 measurement infrastructure 投入来支撑 value calculation。到 2026 年,它主要出现在 financial services、大型 healthcare systems 和 consulting firms 的战略性 enterprise deployments 中,也就是那些既有 analytical sophistication 严格衡量 value,又有 procurement flexibility 结构化非标准合同的买方。
最适合 measured value 足够大、能够支撑运营 overhead 的战略性 enterprise deals。总是与 Sales Catalog Motion 10(Value-Based Engagement)结合。
核心想法。 按已衡量客户价值的一定比例收费,去除传统 vendor-buyer 对立动态:vendor 想为 access 收费,buyer 想为 results 付费。
适用场景。 当客户是成熟 enterprise,既有衡量 value 的 data infrastructure,也有结构化非标准合同的 procurement flexibility。当 deployment 会产生足够大的 measurable、attributable outcomes,以支撑运营 overhead(通常是 $5M+ annual measured value)。当买方的 executive sponsor 有权覆盖 standard procurement。
机制。 Value-Based Pricing 只有在双方能同意 value 的定义和衡量方式时才有效。合同结构比 seat、usage 或 outcome-based pricing 复杂得多。典型协议有四个组成部分。Baseline measurement period(通常是 deployment 前 30–90 天)建立没有 AI 时客户 metrics 的状态。Value-share formula 定义 vendor 捕获 measured gain 的比例,通常为 5–25%,随 deal complexity 和 buyer sophistication 而变化。Ceiling and floor 同时封顶 upside(避免 vendor 收入高到客户 executives 无法内部辩护)和 downside(避免 vendor 变成付钱让客户部署产品)。Audit rights 让 vendor 有能力验证客户在驱动 billing 的 metrics 上的报告;没有 audit rights,customer procurement 会在第一次 true-up cycle 低报 measured value。
运营约束是 contracting maturity。多数 enterprise procurement organizations 还无法规模化结构化 value-based deals;legal、finance 和 operations 都需要理解该模型并有权承诺非标准条款的代表。因此这些 deals 通常需要 C-suite 级别的 executive sponsor:只有这种 authority 才能覆盖 procurement organization 的默认回答「我们不这样结构化 deals」。没有 sponsor,proposal 会无限期卡在组织中层。
财务会计复杂度很高。Value-based contracts 的 ASC 606 revenue recognition 并不简单。Variable consideration 会被约束在公司能以 reasonable reliability 支撑的金额内,这通常意味着在建立 track record 之前,已确认收入会远低于合同 nominal upside。审计师第一年审查这些合同时通常很保守;第三年有多个期间可比数据后,通常会更宽松。
虚构 walkthrough。 想象 CashFlow,一款服务 hedge funds 的 AI 工具。一家 $50B fund 部署 CashFlow,并在 12 个月 measurement period 中,将每年 $40M trading efficiency improvement 归因于该 deployment。CashFlow 的合同按 above-baseline measurable improvement 的 15% 结构化:fund 在合同期内每年支付 $6M。这个 deal 谈了九个月,需要 fund 的 CIO 和 CFO 亲自批准,并且只有 executive sponsor 推动才通过 procurement。CashFlow 的 accounting team 第一年保守确认 $2M revenue,同时建立 audit-defensible track record;第二年,在 value calculation 已由多个 measurement cycles 确认后,确认完整 $6M revenue 才变得 defensible。
Example。 Emerging analogues:Anthropic Applied AI 与 strategic enterprise customers 的一些 engagements。Palantir 围绕 mission outcomes 结构化的一些 deployments。Financial services、healthcare 和大型 consulting firms 中前沿的 AI deployments。这个模式太年轻,还没有 canonical exemplar,但 Big Four consulting practices 已经越来越多地提供 contract templates。
Primary risk。 Contracting collapse。Deal 在组织中层卡几个月,因为 procurement 没有合同结构模板。Mitigation:在起草合同前识别并争取 executive sponsor。Sponsor 的 authority 是 unblock mechanism;没有它,无论方案多合理,deal 都不会关闭。
Secondary risk。 Audit conservatism。ASC 606 下 year-one revenue recognition 可能显著低于合同 nominal value,产生让投资人困惑的 P&L。Mitigation:在签第一份 value-based contract 前聘请有 AI 经验的 revenue accountant;围绕 bookings 以及 recognized revenue 组织 investor reporting。
First move。 不要把 Value-Based Pricing 作为第一个 architecture。先通过 Per-Call(2)、Per-Outcome(3)或 Hybrid(5)建立运营成熟度。只有当公司已有 controller、有经验的 contracts attorney,以及 target buyer 内部的 executive sponsor 后,再尝试 Value-Based。
Approach 5 — Hybrid Pricing
Maturity:Proven。Beginner difficulty:Medium。
白话解释。 Hybrid Pricing 把上面两个或更多 architectures 组合进一份合同。最常见模式是 base subscription(Per-Seat 或 platform fee)加上 included quota 以上的 usage overages:客户对正常 usage 有可预测预算,对 heavy usage 增量付费。其他 hybrids 会把 subscriptions 与 outcome-based bonuses 组合,或把 platform fees 与 per-call infrastructure charges 组合。
到 2026 年,Hybrid Pricing 是规模化 AI-native 公司的主导 architecture。纯 single-architecture pricing 越来越局限于尚未演化模型的早期公司。Hybrids 占主导的原因是,它们平衡了多种 architecture 的结构性优势:subscription 的 predictability、usage 的 cost-alignment,以及(对某些 hybrids 而言)outcome 的 value capture。
最适合作为 Per-Seat 或 Per-Call 在公司达到 mid-market 和 enterprise scale 后的自然演进。它增加运营复杂度,需要谨慎 contract design,以及 customer-success 对买方理解结构的投入。
核心想法。 组合多种架构,平衡 predictability、cost-alignment 和 value capture,达到任何单一 architecture 都无法单独实现的效果。
适用场景。 当 customer revenue 已达到一定规模,纯 per-seat 或 per-call 开始失效(heavy users 压缩 margin、light users 带来 churn risk,或 enterprise buyers 要求更成熟合同)。当团队具备设计并执行 multi-component pricing 所需的 contracting 和 operational maturity。
机制。 AI-native SaaS 中最常见的 Hybrid Pricing 结构是「Per-Seat plus Usage Overage」:客户按每 seat 每月支付固定费用,每个 seat 每月包含一定 AI calls quota,超过 quota 后按 per-call 收费。这个结构保留了买方喜欢的 Per-Seat 预算 predictability,同时保护卖方 gross margin 免受 heavy users 侵蚀。变体包括「Platform Fee plus Usage」(为使用 API 的权利支付固定费用,再按 per-call 收费)、「Subscription plus Outcome Bonus」(base subscription 加 advanced agents 的 per-outcome charges),以及「Tiered Subscription」(多个 subscription tiers,各自有不同 included quotas 和 per-call rates)。
执行它需要三项纪律。Contract design:multi-component pricing 需要严谨的法律和定价策略工作,避免客户困惑或无意的 margin leakage。Usage instrumentation:即使是 hybrid contracts,也需要干净的 usage tracking,用于 overage component 计费和预测 customer behavior。Customer education:operator 和 executive 角色的买方经常难以 forecast hybrid bills;customer-success team 必须投入大量时间帮助客户理解 projected costs。
财务会计复杂度位于 subscription 和 usage accounting 的交叉点。Subscription component 的 revenue 在合同期内按比例确认;usage component 的 revenue 随 usage 发生而确认。ASC 606 会把这些视为 separate performance obligations,因此合同必须按 relative standalone selling prices 在 components 间分配 transaction price。这不是简单练习,通常需要 revenue accountant 明确指导。
规模化后的约束是 communication complexity。无法轻松 forecast 账单的客户会焦虑;焦虑客户会 churn。成熟 hybrid-pricing 公司会投入 dashboards、projection tools 和最大化 predictability 的合同结构,例如 monthly true-up windows 而不是 continuous metering,或 quarterly commitments 并在季度末 review overage,而不是每月底 review。
虚构 walkthrough。 想象 AgentPlatform,一家 AI agent infrastructure 公司。它的 pricing 是 hybrid:客户每月支付 $5,000 platform fee(包含每月 1M agent calls),超过 quota 后每 call 支付 $0.005,采用 annual contracts 和 quarterly true-up。典型客户签下 $60K base annual contract,usage 从 signup 时每月 200K calls ramp 到第十二个月每月 5M calls。第一年结束时,客户实际 revenue contribution 是 $60K(subscription)加 $180K(36M extra calls × $0.005 的 overage)= $240K annual revenue,是 base contract 的四倍。客户账单足够可预测(会收到 quarterly true-up notices);AgentPlatform 的 gross margin 保持干净,因为 heavy usage 的价格高于 compute cost。
Example。 Confirmed examples:GitHub Copilot 的 Business 和 Enterprise tiers(带 usage components 的 subscription)、Cursor 的 enterprise plans(subscription plus token overages)、多数 mature pricing 的 enterprise AI vendors(Glean、Harvey、Sierra 在 large accounts)。Hybrid Pricing 是 2026 年 $10M+ ARR AI-native 公司中的主导 architecture。
Primary risk。 合同复杂度让客户困惑。无法轻松 forecast 账单的买方,比采用简单 pricing 的买方 churn 更高。Mitigation:投入 projection dashboards、使用 quarterly true-up windows 而不是 monthly,并让 customer-success conversations 带新客户走一遍 projected costs。
Secondary risk。 Revenue recognition complexity。Hybrid contracts 的 ASC 606 处理比纯 subscription 或纯 usage 更复杂;standalone-selling-price allocation 中的错误可能造成重大 restatements。Mitigation:在设计 pricing structure 前,聘请熟悉 multi-component AI contracts 的 revenue accountant;不要依赖标准 SaaS revenue-recognition templates。
First move。 如果你的 Per-Seat product 因 heavy users 遇到 margin compression,或 Per-Call product 因 bill anxiety 带来 customer-success burden,就设计一个 hybrid,加上缺失的 component(usage overage 或 subscription floor)。最简单的第一版 hybrid 是「当前 pricing 加一个单一 overage component」;不要第一天就设计六个 component 的合同。
B. 收入与成本机制
财务的技术工作:把 customer activity 转成 auditable books,正确分类 compute costs,并保持 cohort discipline,让 unit-economics truth 浮现。这些 approaches 没有 pricing 那么显眼,但对长期 financial health 更重要。公司可以带着不完美 pricing 生存几年;但经过第一次审计后,无法继续承受不完美的 revenue recognition 或 COGS misclassification。
⚠ 关于会计和税务建议的说明。 本节讨论 revenue recognition(ASC 606)、COGS classification、training costs capitalization、deferred revenue 和 audit defensibility。本目录提供战略框架,并指出你需要回答的问题;它不针对你的具体情况提供专业 accounting、tax 或 audit advice。审计师和 standard-setters 对 AI-native usage-based、outcome-based 和 value-based contracts 的 ASC 606 解释仍在演化。签署第一份 non-subscription contract 前、第一次 audit cycle 前,以及任何依赖下列规则的重大决策前,请聘请有 AI-native 实务经验的 CPA。
Approach 6 — Revenue Recognition for AI Contracts
Maturity:Proven。Beginner difficulty:Medium。
白话解释。 Revenue recognition 是一个会计问题:收入何时算进账本?客户签一份 $1.2M 一年期合同,每月支付 $100K;你是每月记录 $100K revenue,还是第一天记录 $1.2M,还是其他方式?答案由 ASC 606(美国)或 IFRS 15(国际)这类全球会计准则规定。对传统 SaaS,答案很直接:在合同期内按比例确认收入。对 AI-native 公司,事情会复杂:usage-based contracts、outcome-based contracts 和 value-based contracts 各有不同确认规则,而且审计师仍在随着合同结构演化解释这些规则。
把这件事做对很重要,因为它决定公司对投资人说什么、审计长什么样,以及 P&L 实际呈现什么。做错的公司会在第一次审计中面临 material restatements,在 fundraising 时出现意外 revenue holes,并损害需要多年才能修复的 investor credibility。
最适合作为每个阶段的 foundational discipline。不能无限期推迟;公司一旦有任何 revenue,ASC 606 就适用。
核心想法。 把 ASC 606 的五步框架用于 AI contracts:identify the contract、identify performance obligations、determine the transaction price、allocate the price to obligations、recognize revenue as obligations are satisfied。这些 AI contracts 经常包含 variable consideration、multiple performance obligations 和 outcome-dependent payments。
适用场景。 永远适用,从公司有任何 contracted revenue 的那一刻开始。应用复杂度会变化(Per-Seat 简单;Value-Based 复杂),但框架普遍适用。
机制。 传统 SaaS revenue recognition 简单,是因为合同通常只有一个 performance obligation(提供 software access),并在合同期内按比例交付。Revenue 等于 contract price 除以 contract length,并按月确认。ASC 606 在这里没有太多争议。
AI contracts 会以三种结构性方式把这件事复杂化。第一,variable consideration:usage-based 和 outcome-based contracts 的 transaction price 取决于 customer behavior,而它在签合同时并不知道。ASC 606 要求公司估计 variable consideration,但把估计限制在公司能以 reasonable reliability 支撑的金额内;在 track record 建立前,这通常远低于合同 nominal upside。第二,multiple performance obligations:把 subscription、usage 和 outcome bonuses 绑在一起的 hybrid contract 有三个或更多 obligations,每个都需要单独 price allocation 和单独 recognition timing。第三,outcome dependency:在纯 outcome-based contracts 中,只有 outcome delivered 并 confirmed 后才能确认收入;这可能让 contract signing 和 revenue recognition 之间出现 6–12 个月 lag。
实际含义是,AI-native 公司的 bookings(signed deals 的合同价值)和 recognized revenue(P&L 上的 GAAP revenue)会明显分离。某个季度 bookings 可能是 $5M,但 recognized revenue 只有 $1.5M,因为大部分合同是 outcome-based,收入确认被限制在保守估计内。投资人和董事会必须学会同时读两个数字;不熟悉这个 gap 的创始人经常误判公司财务状态。
虚构 walkthrough。 想象 OutcomeAI,一家 AI customer-support 公司。Q1 公司按平均 $2/resolved-ticket 签下 $4M 新 annual outcome-based contracts,预计客户群将产生约 2M tickets。ASC 606 要求只有在 outcomes delivered 时确认收入。到 Q1 结束,只有 200K tickets 被解决(deployment ramp 很慢),产生 $400K recognized revenue。公司 bookings 是 $4M;recognized revenue 是 $400K;deferred revenue(已签但尚未确认的合同)是 $3.6M。P&L 显示 $400K revenue;董事会需要看到所有三个数字:bookings、recognized revenue、deferred revenue,才能理解业务状态。只看到 $400K recognized revenue 就以为业务停滞的创始人是错的;只看到 $4M bookings 就以为公司有 $4M GAAP revenue 的创始人也错。
Example。 Confirmed pattern:每家有 non-subscription contracts 的 AI-native 公司都会遇到这种复杂度。Sierra、Decagon 和其他 outcome-priced 公司会在 investor materials 中报告明显不同的 bookings 和 recognized revenue figures。采用纯 subscription pricing(早期 Per-Seat 或 Per-Call)的公司 recognition 更简单,但在 fundraising 或 M&A 期间仍必须向审计师证明 ASC 606 compliance。
Primary risk。 过激确认,后来被审计师 restate。公司基于对 variable consideration 的乐观假设确认收入;审计师年末不同意;收入向下重述;投资人失去信心。Mitigation:在签第一份 non-subscription contract 前聘请有 AI 经验的 revenue accountant;正式记录 recognition policy;在第一次 audit cycle 期间就与审计师 review policy,而不是事后 review。
Secondary risk。 过度保守确认,隐藏增长。公司确认收入太保守,P&L 看起来比底层业务表现弱;投资人和董事会误判 trajectory。Mitigation:持续、分别报告 bookings、deferred revenue 和 recognized revenue;训练投资人和董事会成员如何同时读取三个数字。
First move。 阅读 FASB 的 ASC 606 standard(或让你的会计师 briefing)。用一页 memo 记录公司的 revenue-recognition policy。在第一次 audit cycle 前,与外部 accountant review。
Approach 7 — Compute COGS Accounting
Maturity:Proven。Beginner difficulty:Medium。
白话解释。 Compute COGS Accounting 是 AI-native 公司在 income statement 上处理 AI workloads 运行成本的方式。Foundation-model API calls、GPU rentals、inference infrastructure、fine-tuning compute 和 embedding generation,都会流入 cost of goods sold(COGS),也就是 P&L 上决定 gross margin 的 line。正确分类这些成本,是公司未来每个 margin metric 的基础。
传统 SaaS hosting costs 很小(通常是收入的 5–15%)[Industry benchmark],因此 COGS line 在概念上不那么重要。对 AI-native 公司,compute 经常是收入的 30–60% [Emerging pattern],这让 COGS 成为 income statement 上最关键的 line。分类错误——把应该费用化的资本化,或把应该资本化的费用化——会产生不反映经济现实的 gross-margin numbers。
最适合作为每个阶段的 foundational discipline。分类规则不是可选项;它影响公司报告的每一个 external metric。
核心想法。 正确区分 compute costs 应进入 cost of goods sold(降低 gross margin)还是 operating expenses(不降低 gross margin),并保持处理一致,让 margin trends 反映经济现实。
适用场景。 永远适用,从公司产生 compute costs 的那一刻开始。复杂度会随成本规模上升,但 discipline 普遍适用。
机制。 AI-native 公司的 compute costs 分为三类,各自会计处理不同。
Direct production compute:运行满足 customer requests 的 AI workloads 的成本。服务 customer queries 时的 foundation-model API calls、生成 customer outputs 时的 GPU inference、customer data 的 embedding generation。这一类明确属于 COGS:它是交付产品的成本,并且随 revenue 扩张。
Product-development compute:训练和 fine-tuning models、evaluation runs、research experiments,以及改善产品但不直接绑定 customer requests 的 infrastructure work。这一类通常是 R&D expense(operating expense,不是 COGS),不过当 resulting model 有明确 useful life 时,有些公司会把 fine-tuning costs 资本化为 intangible assets。资本化选择很重要:capitalized costs 不会降低 current-period earnings,而 expensed costs 会降低。
Internal-use compute:员工使用 AI tools 的成本(engineering productivity、customer support tooling、sales enablement)。无论金额大小,这都属于 operating expense,不是 COGS。
AI-native 公司的结构性问题,是 production compute 和 product-development compute 之间的灰区。团队运行 evaluation pipeline 时,可能同时在做两件事:产生改善 future model performance 的数据(R&D),并验证当前 production model(可能属于 COGS)。清晰、记录成文并一致执行的 allocation policy,是审计师会要求的东西。
另一个会计问题是 prepaid compute commitments。公司为了折扣价格向 cloud providers(AWS Bedrock、Azure OpenAI、GCP)承诺大额 compute purchase 时,会按任何 prepaid expense 的方式处理:在 balance sheet 上记为 asset,随着 compute consumed 计入 COGS。公司购买一年或三年 reserved capacity 时,处理更复杂,可能涉及 ASC 842 下的 embedded leases。
虚构 walkthrough。 想象 AgentCo,一家 $5M ARR 的 AI agent platform。公司每年花 $2M compute:$1.5M 用于 production inference(服务 customer requests),$300K 用于 training 和 evaluation,$200K 用于 internal employee tooling。正确分类下,$1.5M 进入 COGS(对 $5M revenue 的 gross margin 为 70%),$300K 是 R&D expense,$200K 是 general operating expense。若创始人错误地把全部 $2M 放入 COGS,会报告 60% gross margin,这个数字显著更差并误呈现业务。若创始人错误地只把 production inference 放入 COGS,却排除了确实服务 customer requests 的一部分 inference compute(也许团队把 evaluation runs 批处理到同一 GPU pool 上),则会夸大 gross margin。两种错误在规模化后都会放大;任何一种都过不了审计师第一次 review。
Example。 Confirmed pattern:每家 AI-native 公司都必须制定 compute-COGS classification policies。Bessemer Cloud Index 和 a16z 关于 AI margins 的文章都提到,在比较 AI-native company margins 时,一致的 compute classification 非常重要。Public AI companies(当它们大量出现时)必须详细披露 classification policies。
Primary risk。 不一致分类掩盖 margin trends。公司 Q1 用一种方式分类 compute,Q3 用另一种;结果 margin numbers 不可比;投资人失去信心。Mitigation:正式记录 classification policy;一致执行;在第一次 audit cycle 中与审计师 review。
Secondary risk。 过度资本化 development compute 以抬高短期 earnings。有些公司把 model training 和 fine-tuning costs 资本化为 intangible assets,这会改善短期盈利,但代价是 future earnings(capitalized costs 会在 asset useful life 内 amortized)。激进资本化是常见 audit-comment area。Mitigation:对 capitalization 保守处理;除非有清晰、记录成文的资产处理依据,否则大多数 development compute 应费用化。
First move。 列出公司发生的每项 compute cost。把每项分到 production / product-development / internal-use。用一页 policy memo 记录分类规则。从现在起一致执行。
Approach 8 — Cohort Analysis with Model-Cost Decay
Maturity:Emerging。Beginner difficulty:Advanced。
白话解释。 Cohort Analysis 会随时间追踪同一时期获得的 customer groups:它们的 revenue、retention 和 gross margin 随年龄如何变化。传统 SaaS cohort analysis 假设 unit costs 稳定:2023 年获得的客户,到 2026 年服务成本与 2023 年大致相同,因此 cohort 的 gross margin 稳定。
对 AI-native 公司,这个假设在结构上是错的。Foundation-model prices 已经连续几年每年下降 30–60%,并仍在下降 [Emerging pattern: 观察自 2023–2026 年主要 foundation-model providers;下降率由竞争、硬件改进和 architecture innovation 驱动,但没有任何一项保证以同样速度持续]。一个 2023 年获得、毛利率 50% 的 customer cohort,到 2026 年可能以 70% 毛利率运行,不是因为 cohort 做了任何不同的事,而是因为它消耗的 compute 更便宜了。AI-native cohort analysis 必须明确建模这种 model-cost decay,把「价格变化带来的 cohort improvement」与「客户行为带来的 cohort improvement」分开。
这是本目录中分析上最成熟的 approach 之一。它需要 data infrastructure、finance discipline 和早期公司通常还没有的耐心。但做对的公司,会比忽视它的公司更清楚地看到自己的 unit economics。
最适合作为一项随公司成熟逐步发展的 discipline,到 Series B 时变得 essential。在 usage-based 和 outcome-based pricing models 中最强,因为 compute 是成本中的重要部分。
核心想法。 随时间追踪 customer cohorts,并把 cohort behavior(retention、expansion)贡献与 falling model costs(compute price decay)贡献分开,从而理解真实的底层 unit economics。
适用场景。 当公司已有至少 12–24 个月客户数据,并且 measurement 一致。当 compute 是成本中有意义的一部分(通常为收入的 20%+)。当 finance team 拥有按 cohort 随时间追踪 gross margin 的 data infrastructure。
机制。 带 model-cost decay 的 cohort analysis 会分离传统 cohort analysis 混在一起的两个效应。
Cohort behavior effect:这个 cohort 是否留存、扩张、流失?Heavy users 是否变得更 heavy?Light users 是否掉队?这些是传统 cohort analysis 提出的问题,仍然非常关键。
Model-cost decay effect:服务这个 cohort 的成本自 acquisition 以来发生了什么变化?如果 foundation-model prices 在 cohort acquired 后下降 40%,即使 customer behavior 完全没有变化,这个 cohort 的 gross margin 也会相应改善。
方法论要求在 customer behavior 保持不变(或单独衡量其变化)的前提下,把 margin changes 归因给 compute-price decay。多数公司会维护一个「synthetic cost」baseline,也就是该 cohort 按 original acquisition-period prices 会产生的成本,并把 actual current cost 与 synthetic baseline 比较。差值就是 model-cost decay benefit,可能非常大。
战略含义是,AI-native 公司有一个传统 SaaS 没有的内置 margin tailwind。今天获得的 cohorts 在 2028 年会比今天更赚钱,即使 customer behavior 没有变化,因为 compute 会更便宜。明确建模这个效应的公司,能在 CAC payback(可接受比传统 SaaS norms 更长,因为 cohort 会随时间更赚钱)、pricing reductions(公司可以随时间降价以推动 growth 而不牺牲 margin)和 capital allocation(compute-cost-decay 是真实的 margin expansion 形式,会与 revenue growth 竞争 margin driver)上做出更好决策。
虚构 walkthrough。 想象 Sigma,一家 $10M ARR、采用 usage-based pricing 的 AI 公司。2024 cohort acquisition 时平均 gross margin 为 55%。到 2026 年初,同一 cohort 以 72% gross margin 运行。朴素解释是:「cohort 扩张 usage,变得更赚钱了。」带 model-cost decay 的 cohort analysis 显示,customer behavior 只产生了少量变化(来自 increased usage 和 small price increases 的 7% margin contribution),主导效应是 model-cost decay(foundation-model prices 下降贡献 10% margin)。Sigma 现在可以做有依据的决策:保持价格,让 margin 继续扩张;降价,用 cost decay 加速 growth;或把 margin tailwind 投入 feature expansion。没有这项分析,Sigma 可能会错误地把所有 margin improvement 归因于自己的 pricing power,并做出经不起下一轮 model-price competition 的决策。
Example。 Confirmed pattern:Public AI infrastructure companies 和较大的 AI-native vendors 越来越多地在内部运行这项分析。Bessemer Venture Partners 和 a16z growth team 的文章都引用了这个动态。该 discipline 仍在发展,公开 canonical case studies 很有限。
Primary risk。 把 margin improvement 过度归因于 cohort behavior,而实际原因是 model-cost decay。犯这个错误的公司会误判自己的 pricing power,设定在 compute prices 稳定后无法 defend 的 targets,并报告经不起 scrutiny 的 investor metrics。Mitigation:严谨维护 synthetic-cost baseline;在报告 cohort margin trends 时明确分解 behavior 和 decay。
First move。 选择一个大的 customer cohort。计算它 acquisition 时和今天的 gross margin。再计算如果按 acquisition-period compute prices,今天的 gross margin 会是多少。差值就是该 cohort 的 model-cost decay benefit。对其他 cohorts 重复,建立完整图景。
C. Planning & capital allocation
AI-native 公司如何向前看:建模未来、分配资本,并设计能预判 AI 业务独特不确定性的合同结构。这些 approaches 在资本决策发生时最重要:fundraising、hiring sprints、infrastructure commitments、pricing changes。
Approach 9 — Pilot Economics & Contract Mechanics
Maturity:Proven。Beginner difficulty:Medium。
白话解释。 多数 enterprise AI deals 并不会一开始就签 full production contracts。它们通常从 paid pilots 开始:三到六个月、金额为 production contract 一小部分的 engagement,用来证明 AI 在客户承诺 multi-year deployment 前确实有效。Pilot economics 与 production economics 不同:delivery cost 更高(更多 hand-holding)、contract size 更小、revenue recognition timing 不同。因此 pilot economics 应有自己的 accounting 和 forecasting treatment。
正确核算 pilots 的公司,能清楚看到哪些 pilots 转为 production,哪些没有。把 pilot revenue 与 production revenue 混在一起的公司,通常会误判 pipeline health,并错误 forecast。
最适合任何运行 enterprise sales motions 的公司(Sales Catalog Motions 7、8、9、10)。对 average deal sizes 高于 $50K、pilot 是标准 entry mechanism 的公司最重要。
核心想法。 把 paid pilots 作为与 production contracts 不同的 revenue category,拥有自己的 conversion rates、delivery economics 和 forecast modeling。
适用场景。 当公司运行以 paid pilots 作为标准 entry mechanism 的 enterprise sales motion。通常适用于 average deal sizes 高于 $50K 且 sales cycles 超过 60 天的公司。
机制。 Pilot economics 有效,是因为 pilots 的运营现实与 production deployments 根本不同。一个 pilot 通常包含:较小的 contract size(projected production contract 的 10–25%)、定义明确的 success-criteria document、带有大量 customer-success engagement 的 deployment period,以及结束时的 conversion decision。财务含义会传导到多个领域。
Pilot revenue recognition:pilots 通常结构化为带有 defined deliverables 的 fixed-fee engagements。ASC 606 下 revenue recognition 跟随 deliverables:如果 AI 提供 ongoing service,通常在 pilot period 内确认;如果 pilot 被结构化为带 defined output 的 research project,则可能在 completion 时确认。Recognition pattern 取决于 contract structure。
Pilot delivery economics:相对于收入,一个 pilot 会消耗不成比例的 customer-success 和 engineering time。成功 pilots 的 direct cost 常常达到 80–120%(pilot 本身 gross margin 接近零或为负),其经济性由后续 production contract 来 justify。把 pilot delivery costs 当成 production COGS 的公司会错分类 gross margin;把 pilot costs 资本化为 customer-acquisition investment 的公司可能产生不同(也可以说更准确)的财务图景。
Pilot-to-production conversion modeling:不是每个 pilot 都会转化。2026 年成熟 enterprise AI 公司通常看到 50% 到 75% 的 pilot-to-production conversion rates [Emerging pattern: 基于 enterprise AI vendors 公开数据和 investor research;下界常见于首次 deployments,上界属于有成熟 playbooks 的 category leaders],具体取决于 buyer maturity 和 category。假设 100% conversion 的 forecasting models 会夸大 future revenue;完全忽视 pilot economics 的 models 会低估 sales motion 的运营复杂度。
Pilot revenue 是否算 ARR,这个会计问题确实有争议。有些公司把它计入 ARR,并备注 pilot composition;另一些公司排除它,只报告 production-contract ARR。投资人共识越来越倾向于排除:pilot revenue 不是「annual recurring」,因为 recurrence 取决于 conversion。在 fundraising 时把 pilot revenue 放入 ARR figures 的公司,越来越会受到 sophisticated investors 的质疑。
虚构 walkthrough。 想象 MedAI,一款面向 hospital systems 的 AI 工具。MedAI 的标准 enterprise motion 是:90-day paid pilot,费用 $50K;如果成功,则跟进 $400K/year production contract。2026 年,MedAI 签下 12 个 pilots(合计 $600K pilot revenue),其中 8 个转为 production contracts(新增 $3.2M production ARR)。朴素财务图景:$3.8M new revenue。按 pilot economics 调整后的图景:$600K pilot revenue(按交付确认,不 annualized),8 个 production conversions 产生 $3.2M new ARR,4 个没有转化的 pilots(沉没在 customer-success investment 中的成本,以及 future targeting 的教训)。67% 的 pilot-to-production conversion rate 成为影响 sales-motion design 的 tracked metric。
Example。 Confirmed pattern:多数 enterprise AI vendors(Glean、Harvey、Sierra、Cresta、Writer)都运行 pilot-first motions,并把 pilot-to-production conversion 作为 board-level metric 追踪。Accounting 和 reporting treatment 各异;sophisticated investors 在 diligence 中越来越常要求明确拆分 pilot 与 production。
Primary risk。 把 pilot revenue 包含进 ARR figures,随后在 conversion rate 变得可见时失去投资人信任。Mitigation:在所有 investor materials 中把 pilot revenue 与 ARR 分开报告。把 pilot-to-production conversion rate 作为标准 reported metric。
First move。 定义你公司商业结构中的 pilot(size threshold、duration、conversion criteria)。在账本中把 pilots 作为与 production contracts 不同的 revenue category 追踪。向董事会分别报告 pilot revenue、conversion rate 和 ARR。
Approach 10 — Forecasting Under Falling Compute Costs
Maturity:Emerging。Beginner difficulty:Advanced。
白话解释。 为 AI-native 公司构建 12–24 个月 financial forecast,需要明确建模传统 SaaS forecasts 会忽略的一件事:决定你 COGS 的 foundation-model prices 会在 forecast period 内显著下降。假设 compute prices 不变的 2026-period forecast,会在结构上出错:它会低估 out-quarters 的 margin,产生误导性的 runway projections,并误导战略决策。
在 falling compute costs 下做 forecast,需要在 customer-revenue model layer 旁边建立一个单独的 compute prices model layer。两者结合,产生反映业务真实经济轨迹的 gross margin 和 contribution margin forecasts。
最适合任何有 meaningful compute spend 的公司(通常为收入的 20%+)。对正在准备重大 capital decisions 的公司最重要(Series A、Series B、大规模 hiring sprints、infrastructure commitments)。
核心想法。 用两个明确 layer 构建 forecast:customer-revenue model 和 compute-price model,并结合它们产生能预判 foundation models falling-cost trajectory 的 margin projections。
适用场景。 当公司 compute spend 超过收入的 20%。当 forecast period 长于 12 个月。当重大 capital decisions 即将发生(fundraising、大规模招聘、infrastructure commitments)。
机制。 传统 SaaS forecast model 有一个 revenue layer(subscription growth、churn、expansion)和一个 cost layer(compute、sales、marketing、R&D、G&A)。Compute 通常被建模为 revenue percentage,或 fixed-cost-plus-growth model。
AI-native forecast model 会加入第三层:compute-price model。这个 layer 预测 forecast period 内 foundation-model prices 将如何演化。标准方法使用 observed price decay rates(2023 到 2026 年主要 model providers 通常每年 30–60%),并向前投影,同时对 assumed decay rate 做 sensitivity analysis。
组合后的 forecast 会产生经常令人意外的 gross-margin trajectories。一家公司今天 55% gross margin 持平,可能在 18 个月后 forecast 65% gross margin,36 个月后 forecast 70% gross margin,而原因完全来自 compute-price decay,不需要改变 customer pricing 或 behavior。这会创造 flat-margin forecast 看不到的 strategic options:降价以推动 growth(margin tailwind 吸收影响)、扩大 feature investment(future cost base 更低),或只是向投资人提出更高但可信的 target margins。
最常见 failure mode 是对 compute-price decay rate 过度乐观。2023 到 2026 年 foundation-model prices 快速下降,但这个速度并不保证持续。Decay 由 provider competition(可能稳定)、类似 Moore's Law 的 hardware improvements(正在放缓)和 architectural innovations(不可预测)驱动。成熟 forecast models 会包含多个 scenarios:aggressive decay(50%/year)、base case(30%/year)和 conservative(10%/year),并明确 sensitivity analysis。
另一个约束是系统性追踪 compute prices 的 data infrastructure。Foundation-model providers 会频繁改变 pricing;公司必须跨 providers 监控变化,记录 price trajectory,并随 pricing changes 更新 forecasts。试图在 spreadsheets 里做这件事的公司通常会落后;把 tracking 建进 FP&A infrastructure 的公司才能保持 current。
虚构 walkthrough。 想象 GenStudio,一家 $8M ARR 的 AI image-generation 公司,annual compute spend 为 $3M(收入的 37.5%,毛利率 62.5%)。团队正在为 Series B fundraise 做 18 个月 forecast。传统 forecast 假设 compute costs 保持在 revenue 的 37.5%;18 个月后 projected gross margin 仍为 62.5%,公司预计达到 $30M ARR。加入 compute-price-decay layer 后(base case 假设 35%/year decay rate),18 个月后 projected compute spend 是 $3M × (1 − 0.35)^1.5 ≈ $1.5M,对应 projected $30M revenue,gross margin 为 95%。这个数字高得不现实;模型需要 refinement(usage 很可能随 revenue 增长,部分抵消 decay benefit)。现实图景大约落在 18 个月后 70% 到 80% gross margin 之间。无论如何,forecast picture 与朴素 flat-margin assumption 明显不同,战略含义也不同。
Example。 Emerging pattern:准备 Series B 及以后融资的 sophisticated AI-native 公司,越来越明确地建模 compute-price decay。这个 discipline 太年轻,还没有广泛公开的 case studies,但 Bessemer 和 a16z 都发表过引用该动态的研究。Public companies(当它们更多出现时)会在 forward guidance 中面对投资人对 compute-price assumptions 的问题。
Primary risk。 对 decay rate 过度乐观。Aggressive decay assumptions 会产生乐观 forecast,无法承受真实 pricing dynamics。Mitigation:建模多个 scenarios(aggressive、base、conservative);runway planning 用 conservative case,strategic targets 用 base case。
First move。 计算过去六个季度中每个季度 compute spend 占 revenue 的百分比。记录这段时间影响成本的 foundation-model price changes。用 base-case decay rate 向前投影(30%/year 是合理起点),并在 ±20% 做 sensitivity analysis。
Approach 11 — Capital Allocation
Maturity:Proven。Beginner difficulty:Medium。
白话解释。 Capital Allocation 是战略问题:如何把公司新增 dollars 分配到相互竞争的需求上:更多 compute 来扩张产品,更多 engineers 来交付 features,更多 salespeople 来增长 revenue,更多 marketing 来填充 funnel,或更多 cash reserves 来延长 runway。AI-native 公司做出的每一个重大财务决策,本质上都是某种形式的 capital-allocation decision。
让 AI-native capital allocation 不同于传统 SaaS 的维度,是 compute spend curve。Compute 是随 usage 扩张的 variable cost,但它也受到团队如何积极优化的战略选择影响。同样的 dollars,团队可以花在更多 compute 上,以当前效率服务更多客户;也可以花在 engineering work 上,降低 per-call compute cost,从而扩大 future margins。「以当前效率 scale」和「投资 efficiency」之间的取舍,是传统 SaaS 不需要以同样强度面对的战略决策。
最适合作为随公司规模逐步发展的 discipline,到 Series A 变得 essential,到 Series B 成为核心。
核心想法。 把每一美元增量资本都视为 compute、people、customer acquisition 和 runway 之间的战略选择,并明确框架说明如何选择。
适用场景。 从 Series A 开始,当公司有足够资本,需要系统性 allocation,而不是 ad-hoc spending decisions。最重要的时刻是 capital base 发生变化时(fundraises、大客户付款、M&A)。
机制。 2026 年多数 AI-native 公司面对四类增量资本需求。
Compute:支付更多 foundation-model API calls、更多 GPU rentals、更多 training runs、更多 inference capacity。如果架构不变,compute spend 会大致随 revenue 增长;如果公司加入更多 compute-intensive features,则会比 revenue 增长更快。
People:雇更多 engineers、sales reps、marketers、customer-success professionals。People spend 会随公司复杂度增长;成熟 SaaS 中的经验法则是,在美国主要 tech hubs,每位员工 fully loaded 每年大约 $200K–$400K(salary、benefits、equipment、allocated overhead)。
Customer acquisition:paid marketing、sales-development resources、partnership investments、channel programs。CAC spend 会随 growth ambitions 增长;问题是 LTV/CAC math 是否 justify 这笔 spend。
Runway:留在 balance sheet 上的现金。Runway 有战略价值:它让公司有 optionality 去 pivot、度过 downturns,并避免在不利条款下融资。多数公司在 growth phases 低估 runway;也有些公司过度重视 runway,饿死 growth investments。
这里的关键战略概念是 Burn Multiple(由 David Sacks 推广):cash burned 与 net new ARR added 的比率。一家公司 annual burn 为 $5M,同时新增 $5M ARR,则 Burn Multiple 是 1.0;越低越好。成熟 SaaS norms 认为健康 Burn Multiple 应为 1.5x 或更低 [Industry benchmark];AI-native 公司因 compute-cost component 往往更高,在 early-stage growth-mode companies 中 2.0x 也被视为可接受 [Emerging pattern]。
传统 SaaS 不需要面对的 AI-specific capital-allocation 问题,是是否投资 compute efficiency 还是 product scaling。Engineering time 用于优化 prompts、batching inference、distilling smaller models,或构建 custom inference infrastructure,可能带来有意义的 margin improvements(通常 per-call costs 降低 20–40%)。但同样的 engineering time 也可以用于交付推动 revenue growth 的 features。正确答案取决于公司阶段、margin opportunity 的量级,以及客户对新 features 的 pull。
虚构 walkthrough。 想象 FlexAI,一家刚获得 $50M 新资本的 Series B AI 公司。Leadership team 必须在四类需求之间分配资本。基于标准 SaaS playbooks 的默认 allocation 可能是:$20M 给 people growth(扩张 sales 和 engineering),$15M 给 customer acquisition,$10M 留作 runway,$5M 给 compute。AI-native-aware allocation 可能会调整为:$15M 给 people growth,$12M 给 customer acquisition,$10M 给 compute(预判 revenue growth),$8M 给 compute-efficiency engineering,$5M 给 runway。从 $5M 到 $8M 的 efficiency engineering 变化,反映了一个战略押注:未来 $100M revenue base 上 30% margin improvement 每年价值 $30M;即便前期投入很大,这个 payoff 也 justify。
Example。 Confirmed pattern:准备 Series B 及以后 capital-allocation plans 的 AI-native 公司,越来越明确地权衡 compute-efficiency engineering 和其他 capital uses。公开讨论有限;实践更多记录在 board meetings 和 capital plans 中,而不是 published reference 中。
Primary risk。 Compute over-investment。公司过度分配资本给 compute capacity,造成 capacity 超过 demand,并压低 margins。Mitigation:按 demonstrated demand 分配 compute capacity,并设定明确 scale-up triggers,而不是提前承诺 capacity。
Secondary risk。 Compute-efficiency under-investment。公司没有投入 compute efficiency,把 20–40% margin improvements 留在桌面上。Mitigation:每季度 review compute-efficiency engineering opportunities;明确分配 engineering capacity,不让 feature work 挤出 efficiency work。
First move。 为公司建立一页 capital-allocation framework。识别竞争资本的四类(或更多)需求。记录指导 allocation 的原则。每季度 review 该 framework。
D. 外部报告
公司如何与投资人、董事会和审计师沟通。AI-native 公司报告的 metrics、dashboards 和 disclosures 与传统 SaaS norms 有显著不同。
Approach 12 — Investor & Board Reporting
Maturity:Proven。Beginner difficulty:Medium。
白话解释。 Investor & Board Reporting 是把公司财务状态提炼为投资人、董事会成员和审计师期待看到的 metrics、dashboards 和 narratives 的 discipline。对传统 SaaS,canonical metrics 已经很成熟:ARR、NRR、gross margin、CAC payback、Burn Multiple、Magic Number。对 AI-native 公司,同样的 metrics 仍然适用,但必须补充传统 SaaS 不需要的 AI-specific metrics。
只报告传统 SaaS metrics 的公司,会生成错过 AI-native dynamics 的财务图景:model-cost decay、outcome-attribution risk、pilot-to-production conversion、compute-as-percentage-of-revenue。只报告 AI-specific metrics 的公司,又无法与传统 SaaS benchmarks 做有意义比较,也会让锚定这些 benchmarks 的投资人困惑。正确答案是两者都报告,并明确说明这些 metrics 如何关联。
最适合作为随公司成熟逐步发展的 discipline。在 fundraising、board meetings 和 audit cycles 中最重要。
核心想法。 报告所有投资人都期待的 canonical SaaS metrics,同时补充捕捉传统 SaaS 不具备动态的 AI-specific metrics。
适用场景。 从 Series A 开始。Pre-revenue 公司可以推迟其中大部分,不过基础 burn-and-runway reporting 从公司成立就开始。
机制。 一份完整的 AI-native 公司财务报告,通常会包含以下 metrics,并组织成三层。
Tier 1 — 任何 subscription-flavored business 的投资人都期待的 canonical SaaS metrics。ARR(annual recurring revenue)、NRR(net revenue retention)、GRR(gross revenue retention)、gross margin、contribution margin、CAC payback period、Burn Multiple、cash runway in months。这些是 baseline;每个投资人都会问,AI-native 公司要像任何 SaaS 一样报告。
Tier 2 — 捕捉 AI-native dynamics 的 AI-specific metrics。Compute as percentage of revenue(最重要的 AI-specific margin metric,当前 AI-native 公司通常为 20–60%)。Cohort gross margin trend(margins 是否随时间改善,并在 behavior 和 model-cost decay 之间拆分)。Pilot-to-production conversion rate(对运行 enterprise sales motions 的公司)。Outcome attribution accuracy(对 per-outcome pricing 公司,即团队能用 audit-grade telemetry defend 的 contracted outcomes 百分比)。Bookings vs. recognized revenue(对有 non-subscription contracts 的公司,即 contracted value 与 GAAP revenue 之间的 gap)。Model-cost-decay benefit(归因于 foundation-model prices 下降的 margin improvement,并与 cohort behavior 分离)。
Tier 3 — AI-native 公司经常加入的 strategic context。Compute concentration risk(单一 foundation-model providers 中 compute spend 的百分比,捕捉对 Anthropic、OpenAI 等的依赖)。Forecast accuracy(过去 4–8 个 quarters 的 actuals vs. forecast,展示团队 predictive maturity)。Capital allocation breakdown(incremental capital 如何在 compute、people、acquisition 和 runway 之间分配)。
约束是 reporting overhead。每月产出一份完整报告需要有意义的 FP&A capacity;按季度产出有深度的报告,需要 controller 和 senior analyst。试图每月报告一切的公司,通常产出很浅;按季度深度报告的公司,产出更有用的报告。
虚构 walkthrough。 想象 GrowthAI,一家 Series B AI 公司。它们的季度 board report 包含 Tier 1 metrics(ARR $25M、NRR 130%、gross margin 65%、Burn Multiple 1.4x、runway 24 months)、Tier 2 metrics(compute 从一年前 revenue 的 35% 降到 28%、cohort gross margin 每季度上升 2 points 且有明确 decomposition、pilot-to-production 70%),以及 Tier 3 context(90% compute spend 分布在两个 providers、过去八个 quarters forecast accuracy 为 ±8%、$50M capital deployment plan)。报告 12 页,每个 metric 都有明确 narrative。投资人和董事会成员 30 分钟内能读完,并在会议中提出有信息量的问题;重要 dynamics 可见,不需要董事会成员自己挖。
Example。 Confirmed pattern:正在准备或已经进入 Series B 及以后阶段的 sophisticated AI-native 公司,越来越多地产出包含 Tier 2 和 Tier 3 metrics 的报告。格式各异,但底层 discipline 在不同公司之间相似。
Primary risk。 Vanity metrics over substance。团队报告听起来漂亮的数字(signed bookings、total contract value、total registered users),但这些数字不反映底层业务状态。Mitigation:先把 reporting 锚定在 cash、recognized revenue 和 gross margin;只有在明确 context 下再补充 bookings 和 pipeline。
First move。 列出上一份 board report 包含的 metrics。与上面的 Tier 1、Tier 2 和 Tier 3 列表比较。找出两三项真正会改善报告的新增指标。
E. 指标与 KPI 框架
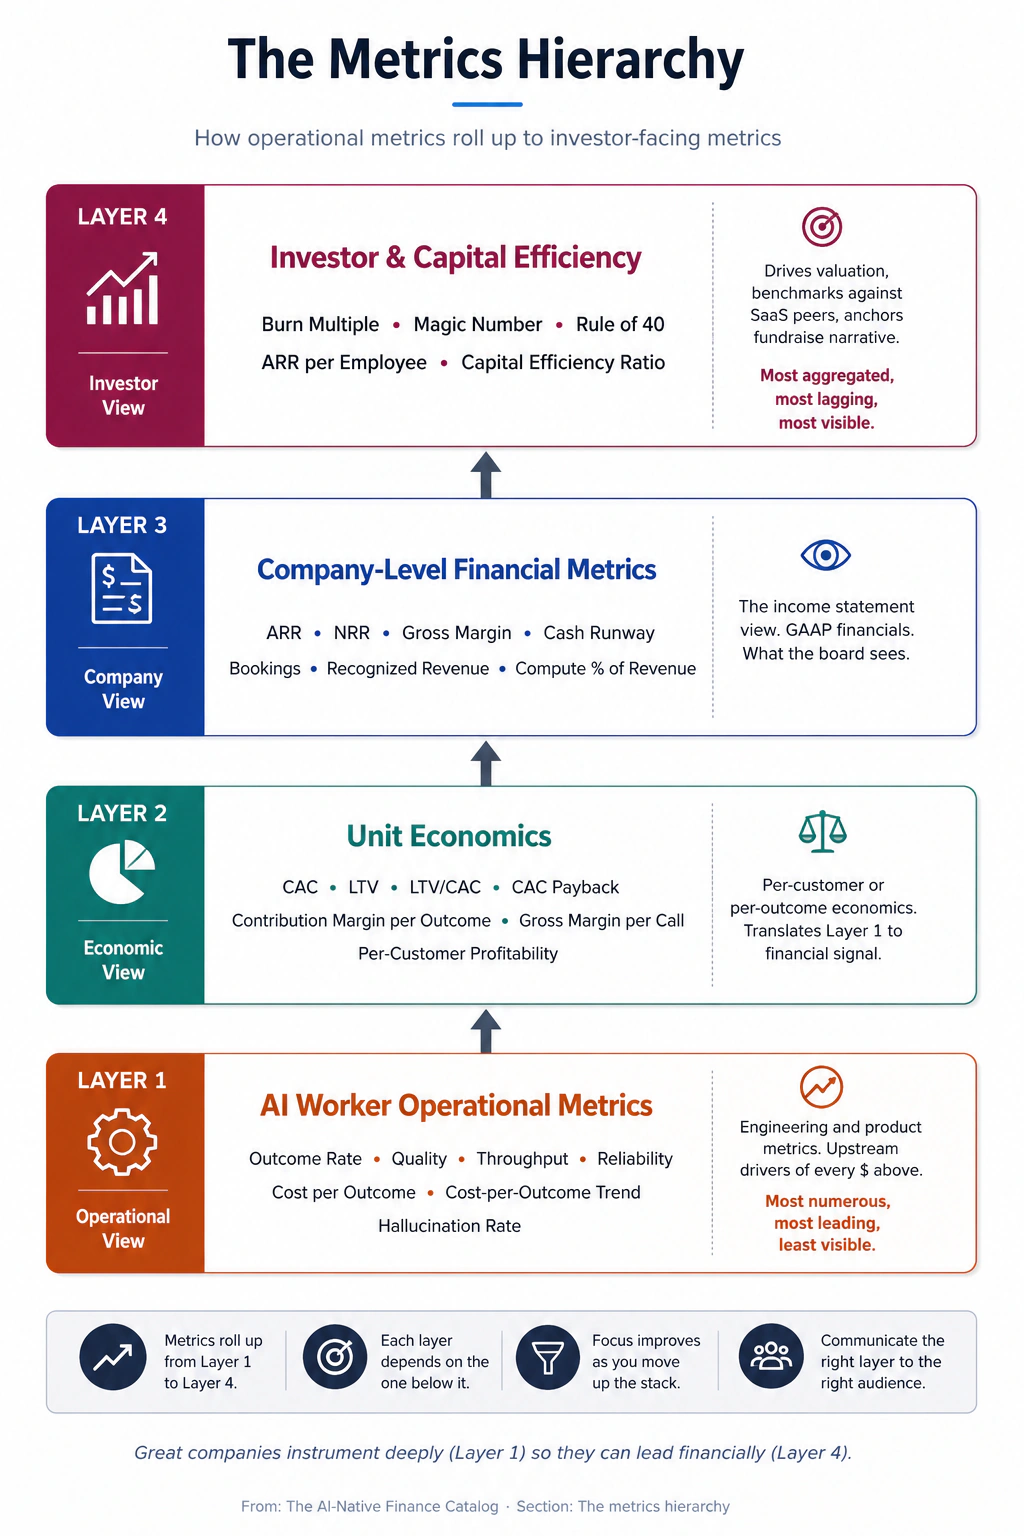
前四节覆盖 AI-native finance 做什么(price、account、plan、report)。本节覆盖 AI-native finance 衡量什么:决定 AI-native 公司是否成功的具体 metrics 和 KPIs,并组织成一个 hierarchy,从 operational layer(per-AI-worker performance)一路到 unit-economics layer(per-customer 或 per-outcome profitability),再到 company-level financial layer(gross margin、ARR、runway),最后到 investor-facing layer(Burn Multiple、capital efficiency)。
本节是目录中最具处方性的部分。前面的 approaches 给你 architecture choices;本节给你应该实际追踪的数字、计算公式、区分健康与不健康的 thresholds,以及一家 $10M ARR AI-native 公司的 worked example dashboard。
指标层级
每家 AI-native 公司的财务现实,都会从四层 metrics hierarchy 中浮现。每一层都会馈入上一层。
Layer 1 — AI Worker operational metrics。 AI 本身的 performance:outcomes produced、accuracy、escalation rates、throughput。这些是 engineering 和 product metrics,传统 finance 通常不参与;但对 AI-native 公司,它们是每个财务数字的 upstream drivers。一个 90% outcome rate、5% escalation rate 的 AI Worker,与一个 60% outcome rate、35% escalation rate 的 AI Worker,会产生完全不同的 unit economics,不管合同如何定价。
Layer 2 — Unit economics。 Per-customer 或 per-outcome profitability。Contribution margin per outcome、gross margin per call、customer LTV、CAC per cohort、LTV/CAC ratio。这些 metrics 会把 Layer 1 operational performance 转换为财务信号:高 escalation rate(Layer 1)会表现为低 gross margin per outcome(Layer 2)。
Layer 3 — Company-level financial metrics。 公司的 aggregate financial state。ARR、NRR、gross margin、contribution margin、cash burn、runway。这些是 income statement 和 cash-flow report 上的 metrics,也就是业务的 GAAP view。它们汇总了所有客户和所有时期的 Layer 2 unit economics。
Layer 4 — Investor and capital-efficiency metrics。 用来把公司与 benchmarks 比较、驱动 valuation、指导 fundraising 的 metrics。Burn Multiple、Magic Number、Rule of 40、ARR per employee、capital efficiency ratios。这些 metrics 源自 Layer 3 financials,但强调 efficiency 和 benchmarking,而不是 absolute performance。
对 AI-native finance teams 的关键 insight 是:只报告 Layer 4 metrics(最容易产出)的公司,其实是在看不见真正驱动业务的因素。诊断信息位于 Layers 1 和 2;战略叙事位于 Layer 3;investor pitch 位于 Layer 4。成熟 finance functions 会报告全部四层,并明确连接它们之间的因果关系。
AI Worker operational KPIs
Layer 1 metrics,也就是 AI 本身的 performance,是最新、也是传统 finance literature 最少覆盖的部分。可它们是每个 financial KPI 的 upstream drivers。追踪得好的公司,会比这些趋势进入 P&L 早三到六个月看到 gross-margin trends;忽视它们的公司,只能被动面对自己解释不了的 financial outcomes。
六个核心 AI Worker operational metrics 适用于大多数 worker types:
1. Outcome rate。 尝试中产生 successful outcome 的百分比。对 customer-support AI:resolved without escalation 的 tickets 除以 total tickets received。对 sales-outreach AI:booked meetings 除以 total messages sent。对 code-generation AI:human reviewer 接受的 generated code 除以 total generation attempts。
Outcome rate = Successful outcomes / Total attempts
健康区间会因 worker type 大幅不同。Customer support:60–85%。Sales outreach:2–15%(低得多,因为 buyer-side response rate 是瓶颈)。Code generation:30–70%。Baseline 是 human-only rate;如果 AI Worker 能以显著更低成本持续超过 baseline,就说明它在成功。
2. Quality。 AI 产生 outcome 的 human-rated 或 auditor-rated quality。对 customer support:post-resolution customer satisfaction(CSAT)scores。对 document analysis:audit sample 中被标记为 correct 的 analyzed documents 百分比。对 meeting summarization:decisions 和 action items 被正确捕捉的百分比。
Quality = Average rated score (1–5 or 1–10 scale) across audited outcomes
Outcome rate 和 quality 之间的 gap 在运营上非常重要。一个 90% outcome rate、60% quality score 的 AI,会产生大量技术上算作「outcomes」的坏结果。两个 metrics 放在一起才给出真相。
3. Throughput。 单位时间产生的 outcomes。每小时 resolved tickets、每分钟 generated summaries、每天 processed claims。与同一 workflow 中的人类 throughput 比较时,throughput 才具有财务意义;这个倍数就是 automation leverage。
Throughput = Outcomes / Time period
Automation leverage = AI throughput / Human throughput
执行结构化任务(claims、document analysis、simple support)的典型 AI Worker,相比人类 equivalent 会有 5–20x automation leverage。执行 creative 或 judgment-heavy tasks 的 AI Workers 通常为 2–5x。需要 AI 无法访问的 context 的 tasks,automation leverage 接近 1x,通常不应部署。
4. Reliability。 AI Worker performance 的一致性:uptime、error rate、异常 inputs 下的 behavior。它包括 infrastructure reliability(uptime)和 behavioral reliability(相似 inputs 上 outcomes 的一致性)。
Reliability = (Uptime %) × (1 − Error rate) × (Behavioral consistency score)
Reliability 决定 AI Worker 是否可以被信任并进入 production。一个 outcome rate 很高、但相似 inputs 上 behavior 变化很大的 AI,即使 average performance 很好,也不能部署到 regulated industries。
5. Cost per outcome。 产生一个 outcome 的 fully-loaded cost,包括 foundation-model API costs、supporting infrastructure、monitoring,以及按比例分配的 engineering 和 customer-success time。
Cost per outcome = (Compute cost + Infrastructure cost + Allocated overhead) / Total outcomes produced
这是 finance 最重要的 Layer 1 metric,因为它直接驱动 gross margin per outcome(Layer 2)。Customer-support AI 的典型区间是每张 resolved ticket $0.20–$0.80。Sales-outreach AI:每次 booked meeting $0.50–$3。Code-generation AI:每条 accepted code suggestion $0.10–$1。
6. Cost-per-outcome trend。 Cost per outcome 随时间变化的速度。随着 foundation-model prices decay(每年 30–60%)、团队优化 prompts,以及 caching 和 batching 提升效率,它应该随时间下降。持平或上升的 trend 表示有问题,可能原因包括:model-cost-decay benefits 没有被捕获(仍在用更贵的 models)、workflow drift(AI 被要求做越来越难的事情),或 infrastructure inefficiency。
Cost-per-outcome trend = (Cost per outcome this period − Cost per outcome prior period) / Cost per outcome prior period
健康 AI Worker 的 cost-per-outcome 每年下降 20–40% [Author thesis: 来自 observed model-price decay 加典型 prompt-optimization gains;应以你自己的 deployment 数据验证]。这个 decay 是 Approach 8 中 model-cost-decay margin tailwind 的运营侧对应物。
这六个 metrics 合在一起回答运营问题:这个 AI Worker 是否成功,它以多大 margin 成功,成功是否随时间改善?对 production 中每个 AI Worker 追踪这些 metrics 的公司,会提前看到 margin issues、customer-success problems 和 competitive pressure。不追踪的公司,会在三到六个月后从 financial statements 中得知同样问题,那时已经更难修复。
Per-architecture financial KPIs
Section A 中每种 pricing architecture 都有自己的 financial KPIs,用来判断该 architecture 是否有效。Metrics 有重叠,但重点不同。
Per-Seat Pricing KPIs。 当 revenue 随 seats 扩张时,重要 metrics 是:
- Seats sold(gross)、seats churned(gross)、net seats added:任何 per-seat business 的基础 flow metrics
- Seat utilization rate:paid seats 中有 monthly active usage 的百分比;健康区间为 60–85%,低于 50% 表示存在大量 billing-without-value 风险
- ARPU(Average Revenue Per User):total revenue 除以 active users
- ARPA(Average Revenue Per Account):total revenue 除以 paying accounts
- Compute cost per seat:AI-specific addition;这是 heavy users 带来 margin compression 的主要 indicator
- Compute-cost-per-seat distribution:heavy/medium/light user breakdown;如果 heavy-user compute 超过 seat revenue 的 80%,architecture 需要演化
Seat utilization rate = Active users / Paid seats
ARPU = Total revenue / Active users
Compute cost per seat = Total compute cost / Paid seats
Per-Call / Usage Pricing KPIs。 当 revenue 随 consumption 扩张时,重要 metrics 是:
- Active customers:该期间有任何 billable usage 的客户
- Calls per active customer:每个客户的 usage intensity
- Revenue per call:所有 billable calls 的 average revenue
- Gross margin per call:(Revenue per call − Cost per call) / Revenue per call;结构上应保持 60%+
- Customer concentration:top 5/10/20 customers 贡献收入百分比;top 5 超过 30% 表示 concentration risk
- Usage growth rate:每个客户 calls 的 month-over-month 增长;早期产品阶段健康区间为 5–15% MoM
- Bill-shock churn rate:明确因 billing surprise 而 churn 的客户;超过 5%/year 表示 bill management 的 customer success 不足
Calls per active customer = Total billable calls / Active customers
Gross margin per call = (Revenue per call − Cost per call) / Revenue per call
Customer concentration (top 5) = Revenue from top 5 customers / Total revenue
Per-Outcome Pricing KPIs。 Outcome-based architectures 的 specific metrics:
- Outcomes delivered per period:volume metric;revenue 的 upstream driver
- Outcome attribution accuracy:团队能用 audit-grade telemetry defend 的 delivered outcomes 百分比;应为 95%+
- Outcome dispute rate:customers dispute 的 billable outcomes 百分比;超过 3% 表示 attribution-infrastructure problems
- Average revenue per outcome:公司每个 outcome 捕获的 price
- Cost per outcome:每个 outcome 的 total cost(compute + supporting infrastructure + allocated overhead)
- Contribution margin per outcome:(Revenue per outcome − Variable costs per outcome) / Revenue per outcome
- Customer outcome consumption growth rate:按客户追踪 usage trajectory
Contribution margin per outcome = (Revenue per outcome − Variable costs per outcome) / Revenue per outcome
Outcome attribution accuracy = Outcomes with audit-grade telemetry / Total outcomes billed
Value-Based Pricing KPIs。 最成熟 architecture 的 metrics:
- Baseline measurement period results:客户 deployment 前的 metrics
- Measured value vs. baseline:驱动 billing 的 gap
- Value-share capture rate:vendor 对 measured gap 的 share;通常为 5–25%
- Audit completion rate:完成 audit cycles 的合同百分比;低于 80% 表示 audit-rights infrastructure broken
- Variable consideration recognition rate:contracted upside 中实际确认为 revenue 的百分比;早年因 ASC 606 conservatism 可能低至 30–50%,随着 track record 成熟而上升
- Customer renewal rate at contract end:这类合同有天然 expiration cliffs;renewal rate 是 durability test
Hybrid Pricing KPIs。 多个 components 组合时的重要 metrics:
- Subscription-vs-usage revenue split:每个 component 的 revenue 百分比;追踪 mix 如何演化
- Overage rate:超过 included quota 的 customers 百分比;健康区间 30–60%,表示 pricing 校准正确
- Average overage revenue per overage customer:heavy users 带来的 upside
- Conversion to higher tier:overage customers 升级到更高 subscription tiers 的百分比
- Bill predictability score:每个客户 monthly bills 的 variance;variance 越低,churn 越低
各阶段指标优先级
不同指标在公司成熟度的不同阶段重要性不同。Pre-revenue 公司沉迷 Burn Multiple 是浪费时间;Series B 公司还停留在追踪 ARR,则报告太薄。
Pre-revenue(Seed)。
Top 3 metrics:cash runway(以月计)、monthly burn(dollars)、lead indicators(waitlist signups、design-partner conversations、beta users)。其他都跳过。ARR、NRR、gross margin、CAC 还没有意义:数据太少,pattern 下个季度就会变化,把时间花在计算上不如赢得下一个客户。
Early revenue($1M–$5M ARR)。
Top 5 metrics:ARR、gross margin(明确 compute-cost line)、cash runway、NRR(gross + net)、CAC payback period。开始追踪;还不要优化。这些 metrics 建立 Series A diligence 所需 baseline;第一年的 values 没有 trajectory 和团队解释能力重要。
Mid stage($5M–$25M ARR)。
Top 7 metrics:以上 metrics 加上 Burn Multiple、contribution margin、pilot-to-production conversion(如果是 enterprise sales motion)、compute as percentage of revenue。开始重要:带 model-cost decay 的 cohort analysis、customer concentration。从「tracking metrics」到「optimizing metrics」的转变发生在这个阶段;finance function 从 scorekeeping 变成 strategic input。
Scaling($25M+ ARR)。
Approach 12 中的完整 Tier 1、Tier 2 和 Tier 3。所有 metrics 都重要。战略问题是 reporting cadence:哪些 metrics 每周 review(cash、pipeline、top-customer health),哪些每月 review(full P&L、gross margin trends、cohort analysis),哪些每季度 review(包含三层的 full investor report),哪些每年 review(audit、full strategic financial review)。
最常见的 stage-related mistake,是在 Series A 规模报告 Series B metrics。一个 pre-product-market-fit 公司做出 14 页 board deck,包含 cohort analyses、capital efficiency ratios 和 Rule of 40 calculations,其实是在表演 finance theater。董事会想看 runway、burn 和 customer count;其他在这个阶段都是 overhead。
AI-specific operational efficiency KPIs
这些是 engineering-finance bridge metrics:engineering 和 finance 必须一起追踪,因为它们直接决定 unit economics。传统 SaaS finance 不参与这些,是因为 hosting costs 太小而不重要;AI-native finance 必须参与。
Cost per token(input vs. output)。 Foundation-model API calls 的 unit cost。分别追踪 input tokens(prompt)和 output tokens(response),因为不同 providers 的 pricing 可相差一个数量级。随时间追踪,因为 foundation-model pricing 频繁变化;季度快照会错过动态。
Inference cost per query。 Total compute cost(foundation-model API + supporting compute)除以 total queries served。最重要的 AI-specific operational metric,因为它直接决定 gross margin per call(Layer 2)。
Inference cost per query = (Foundation-model API cost + Supporting compute cost) / Total queries served
Cache hit rate。 对有 response caching 的系统,requests 中从 cache 服务、而不是需要 full inference 的百分比。30% cache hit rate 会带来有意义的 cost savings;60%+ cache hit rate 会改变 unit economics。
Batch processing efficiency。 对可 batch 的 workloads(overnight processing、retry queues、bulk operations),batched 与 real-time 的 cost per outcome。Batched costs 通常比 real-time 低 50–80%;未 batch 符合条件 workloads 的公司,会把大量 margin 留在桌面上。
Model utilization rate。 对 self-hosted infrastructure,GPU utilization percentage。低于 40% 表示 over-provisioned infrastructure;持续 80%+ 表示 capacity-planning 需要关注。
Prompt token efficiency。 每个 input token consumed 产生的 output value。它衡量 prompt design quality:高效 prompts 用最少 input context 产生高价值 outputs。
Time-to-first-token / time-to-completion。 影响 customer experience 的 performance metrics;对某些 workloads,它们决定 AI Worker 是否能与 human alternatives 竞争。
Capital efficiency metrics beyond Burn Multiple
Burn Multiple 只是更大 capital-efficiency framework 中的一个指标。AI-native 公司应追踪并报告更完整的一组:
ARR per employee。 Total ARR 除以 total full-time employees(包括折算为 FTE-equivalent 的 contractors)。这是最直接的 revenue productivity 指标。成熟 SaaS 目标为每人 $200K–$400K;$5M–$25M ARR 区间的 AI-native 公司通常为每人 $150K–$300K,因 engineering intensity 更高而略低。
ARR per employee = Total ARR / Total FTEs
Gross profit per employee。 ARR per employee 乘以 gross margin。它会调整 AI-native lower-gross-margin reality,并在 SaaS 和 AI-native 公司之间产生更可比的 metric。
Gross profit per employee = (Total ARR × Gross margin) / Total FTEs
R&D as percentage of revenue。 Research and development spend(engineering、product、design)除以 revenue。AI-native norms 在 growth phases 通常为 35–55%(高于 SaaS norms 的 25–40%),原因是 engineering intensity 以及 AI Finance Engineer / AI Outcome Engineer roles。随着公司 scale,会下降到接近 SaaS norms。
S&M as percentage of new ARR。 某一期间 sales and marketing spend 除以同一期间 net new ARR added。它是 Magic Number 的倒数;越低越好。成熟 SaaS 目标为 100–150%(每 $1 S&M dollar 在该期间产生 $0.67–$1 net new ARR);AI-native 公司早期常为 80–120%,因为 product-led acquisition 更强。
G&A as percentage of revenue。 General and administrative spend 除以 revenue。成熟 SaaS norms 为 10–15%;AI-native norms 类似。高于 20% 表示 organizational bloat 或过早 CFO/finance build-out。
Rule of 40。 Annual revenue growth rate 加 EBITDA margin。这是 canonical SaaS efficiency benchmark;成熟公司应超过 40%。Growth phase 的 AI-native 公司经常低于这个阈值(高 growth 被深 operating losses 抵消),并在 scale 后逐步达到 Rule of 40。
Rule of 40 = Annual revenue growth % + EBITDA margin %
Rule of 50/60 for fast-growing AI-native companies。 有些 AI-native investors 对 hypergrowth AI-native 公司采用 Rule of 50 或 Rule of 60,也就是接受更深 losses 来换取更快 growth。它不如 Rule of 40 普遍,但被越来越多提及。
Capital efficiency ratio。 Total ARR 除以至今 total capital raised。它衡量公司部署融资资本的生产率。成熟 SaaS 目标为 1.5x 或更高;早期 AI-native 公司常为 0.5–1.0x,并随时间改善。
Capital efficiency ratio = Total ARR / Total capital raised
Worked example: AgentCo at $10M ARR
为了让这个 framework 更具体,考虑一家 $10M ARR 的虚构 AI-native 公司。下面的 metrics 代表一家健康 mid-stage AI-native 公司;偏离这些 benchmarks 的地方,就是问题或机会的排查方向。
Company profile。 AgentCo 是一家 AI customer-support automation 公司。Pricing 是 hybrid:每客户 $5,000/month subscription(包含每月 50,000 resolved tickets),超过 included quota 后每张 ticket 收 $0.50。100 customers,average $100K ACV。50 employees。Series A close(raised $30M)后 18 个月;准备在 12–18 个月后进行 Series B。
Annual P&L。
| Line item | Amount | % of revenue |
|---|---|---|
| Bookings (signed contracts) | $14M | 140% |
| Revenue (recognized GAAP) | $10M | 100% |
| COGS | ||
| Compute (foundation-model API) | $2.5M | 25% |
| Hosting & infrastructure | $400K | 4% |
| Customer-success allocation (variable) | $600K | 6% |
| Total COGS | $3.5M | 35% |
| Gross profit | $6.5M | 65% |
| Operating expenses | ||
| R&D (20 engineers) | $4M | 40% |
| Sales & Marketing | $3.5M | 35% |
| G&A | $2M | 20% |
| Total OpEx | $9.5M | 95% |
| Operating loss | ($3M) | (30%) |
| Cash burn (after working-capital benefit) | ($2.5M) | (25%) |
| Cash on hand | $25M | — |
| Runway | 按当前 burn 为 10 years | — |
Layer 1 — AI Worker operational metrics。
| Metric | Value | Healthy? |
|---|---|---|
| Outcome rate (tickets resolved without escalation) | 78% | Yes (60–85% range) |
| Quality (CSAT post-resolution) | 4.4 / 5 | Yes |
| Throughput (resolutions per hour) | 120 | Yes (vs. human 8/hr = 15x leverage) |
| Reliability (uptime × consistency) | 99.5% × 96% = 95.5% | Yes |
| Cost per outcome | $0.42 | Yes ($0.20–0.80 range) |
| Cost-per-outcome trend (YoY) | −28% | Yes (within 20–40% target) |
Layer 2 — Unit economics。
| Metric | Value | Healthy? |
|---|---|---|
| ACV (Average Contract Value) | $100K | — |
| CAC | $50K | — |
| LTV (5-year, with 130% NRR) | $500K | — |
| LTV/CAC ratio | 10x | Excellent (target > 3x) |
| CAC payback period | 14 months | Healthy (target < 18 months) |
| Contribution margin per ticket resolved | 16% (revenue $0.50, cost $0.42) | Tight; room for compute optimization |
| Contribution margin per customer (full bundle) | 71% | Healthy |
Layer 3 — Company-level financial。
| Metric | Value | Healthy? |
|---|---|---|
| ARR | $10M | — |
| Bookings | $14M | — (40% above ARR; sign of healthy growth) |
| NRR | 128% | Strong (target > 110%) |
| GRR | 92% | Healthy (target > 90%) |
| Gross margin | 65% | Healthy AI-native (target 60–70%) |
| Compute as % of revenue | 25% | Healthy (target < 30% at this stage) |
| Cash runway | current burn 下 120 months | — (will reset on Series B) |
| Pilot-to-production conversion | N/A | (PLG-led, not enterprise pilots) |
| Cohort gross margin trend | +3 points/quarter | Strong (model-cost decay contributing 2 points; usage expansion 1 point) |
| Compute concentration | 75% with one provider | Risk; multi-provider strategy needed |
Layer 4 — Capital efficiency & investor metrics。
| Metric | Value | Healthy? |
|---|---|---|
| Burn Multiple ($2.5M burn / $3.5M new ARR) | 0.7x | Excellent (target < 2.0x for AI-native) |
| Magic Number ($3.5M new ARR / $3.5M S&M last year) | 1.0 | Healthy |
| ARR per employee ($10M / 50) | $200K | Acceptable for AI-native at this scale |
| Gross profit per employee | $130K | Acceptable |
| R&D as % of revenue | 40% | High but appropriate at this stage |
| S&M as % of new ARR | 100% | Healthy |
| G&A as % of revenue | 20% | High; review for premature G&A build-out |
| Rule of 40 (40% growth + (-30%) EBITDA) | 10% | Below target; growth and margin both need improvement |
| Capital efficiency ratio ($10M ARR / $30M raised) | 0.33x | Below target (1.5x); typical for early-stage |
这个 dashboard 告诉团队什么。
AgentCo 是一家健康的 mid-stage AI-native 公司,unit economics 很强,pricing architecture 有效,并且有干净的 operational story 可以讲给投资人。0.7x 的 Burn Multiple 和 10x 的 LTV/CAC 确实很强,说明 customer acquisition machine 正在产生高效增长。128% NRR 表明现有客户群在扩张;65% gross margin 和 25% compute 也处在该阶段应有位置。
需要关注的区域也很清楚:20% 的 G&A 暗示团队已经搭建了超过公司当前承载能力的 overhead(很可能是在 $25M ARR 前就有了 controller 加 full FP&A function,过早)。75% compute concentration with one provider 是 vendor risk,应在 Series B diligence 前缓解。10% 的 Rule of 40 由 operating loss 驱动,很可能是影响 Series B valuation conversations 的 metric;团队应规划如何在融资前把这个数字提升到 25%+:要么加速 growth,要么压缩 operating losses。
Layer 1 operational metrics(outcome rate 78%、cost per outcome $0.42 且 YoY decay 28%)是 financial trajectory 可持续的 leading indicators。如果 outcome rate 下滑或 cost-per-outcome 持平,上面的 financial metrics 就会成为底层运营问题的滞后指标;这里 operational metrics 反而确认了财务叙事。
创始人读这个 dashboard,会看到一家基本健康、但接下来 12 个月需要三件具体事的公司:G&A discipline($20M ARR 前不再新增 finance hires)、compute concentration mitigation(把 multi-provider integration 作为 engineering project),以及 Rule of 40 improvement(加速增长或压缩 operating loss)。这些就是 dashboard 暴露出的 action items;没有完整视图,团队会优化错误的东西。
F. AI Worker 参考与基准
Section E 给出 framework:四层 hierarchy、architecture-specific KPIs、stage priorities 和 worked dashboard。Section F 是其下的 reference layer:为每种 AI Worker type 提供具体 KPI cards、用于快速比较的 consolidated benchmarks、解读偏离值的 diagnostic playbooks、不同阶段和 architectures 的 dashboard templates,以及 compute economics deep-dive。本节是为了导航而组织的,不适合线性阅读:需要时直接查具体 card 或 table。
Per-worker-type KPI cards
Section E 的 framework metrics 适用于不同 worker types。实际 benchmarks、pricing 和 unit economics 会因 AI Worker 所做的工作而明显不同。下面十二张 cards 覆盖 2026 年最常见的 AI Worker categories,每张都有 operational KPIs、financial KPIs 和 worked unit economics。把它们当作起步 templates;再根据你的具体 deployment 调整。
关于下列 cards 的置信度说明。 大多数 operational ranges(acceptance rates、accuracy thresholds、latency targets)位于 [Industry benchmark] 和 [Emerging pattern] 之间,反映已发布 vendor data 和 research 中较充分观察到的从业者共识。大多数 financial ranges(revenue per outcome、cost per outcome、contribution margin、LTV/CAC)属于 [Author thesis]:它们是从 observed deployments 和 vendor disclosures 推断而来,对 model choice、prompt efficiency 和 customer mix 敏感。请把这些 ranges 当作起始参考;在做重大决策前,用你自己的数据验证。
1. Customer Support AI Worker
Use cases。Inbound support ticket triage、automated response generation、deflection of common queries、escalation routing。
Typical pricing。Per-Outcome(per resolved ticket)或 Hybrid(subscription + per-ticket overage)。
Operational KPIs。Resolution rate(resolved without escalation):60–85%。CSAT post-resolution:4.0–4.5/5。Mean time to resolution:30 seconds–5 minutes(vs. human 15–60 min)。False-resolution rate(recurring tickets):below 5%。Escalation accuracy(correctly escalates to right human):above 90%。Hallucination rate on factual responses:below 1%。
Financial KPIs。Revenue per resolved ticket:$0.50–3.00。Cost per resolved ticket:$0.20–0.80。Contribution margin per ticket:50–75%。LTV/CAC:5–15x mid-market,10–25x enterprise。NRR:110–140%(volume expansion as customers ramp confidence)。
Worked unit economics。客户为每张 resolved ticket 支付 $1.50。Compute cost:每次 resolution $0.45。Allocated overhead:$0.15。Contribution margin:($1.50 − $0.60) / $1.50 = 60%。一个每月 50K tickets 的客户会产生 $75K/month revenue 和 $45K/month gross profit。
2. Sales Outreach AI Worker (SDR)
Use cases。Outbound prospecting、personalized email drafting、follow-up sequencing、meeting booking、CRM data enrichment。
Typical pricing。Per-Outcome(per booked meeting)或带 usage caps 的 Per-Seat。
Operational KPIs。Reply rate(positive responses):2–8%。Meeting-booked rate(replies → meetings):10–25%。Personalization accuracy(AI-generated personalization rated correct):above 80%。Sequence completion rate:75–90%。Bounce rate:below 5%。Compliance violation rate(CAN-SPAM、GDPR):must be 0%。
Financial KPIs。Revenue per booked meeting:$50–300。Cost per booked meeting:$5–50。Meetings → opportunities conversion:30–60%。Opportunities → closed deals:15–35%。AI tool 自身的 LTV/CAC:8–20x。CAC payback period:8–14 months。
Worked unit economics。客户为每次 booked meeting 支付 $200。Compute cost(research + drafting + follow-up):每次 booked meeting $25。Customer success allocation:$15。Contribution margin:($200 − $40) / $200 = 80%。每月 booking 100 次 meetings 的客户,会产生 $20K revenue 和 $16K gross profit。
3. Code Generation AI Worker
Use cases。In-IDE code completion、full function generation、refactoring、test generation、code review。
Typical pricing。带 usage caps 的 Per-Seat(developer subscription),或 Hybrid(subscription + token overages)。
Operational KPIs。Acceptance rate(developer 接受代码):25–45%。Pass rate(代码第一次通过 tests):60–80%。Time saved per accepted suggestion:30 seconds–5 minutes。Hallucination rate(fabricated APIs/functions):below 2%。Latency to first token:below 200ms。Edit distance(developer 对 AI output 的修改):低于 lines 的 30%。
Financial KPIs。Revenue per developer seat:$20–100/month。Compute cost per seat:$5–30/month。Gross margin per seat:65–80%。Active developer rate:paid seats 的 70–90%。NRR:110–125%(accounts 内 seat expansion)。LTV/CAC:4–10x。
Worked unit economics。$40/month per seat。Compute cost:每 active seat $12/month。Allocated infra:$3。Contribution margin:($40 − $15) / $40 = 62.5%。一个 1,000-developer 客户产生 $40K MRR 和 $25K gross profit MRR。
4. Document Analysis AI Worker
Use cases。Contract review、invoice processing、due-diligence document scanning、regulatory filing analysis。
Typical pricing。Per-Outcome(per processed document)或带 quality tiers 的 Per-Outcome(human-validated output 收 premium)。
Operational KPIs。Processing accuracy(audit-sample correctness):92–98%。Throughput:100–10,000 documents/hour vs. human 5–50/hr。Confidence calibration(predicted accuracy matches actual):r² above 0.85。Hallucination rate on extracted facts:below 1%。Review-flag rate(flagged for human review 的 documents):5–20%。Cost per processed page:$0.05–0.50。
Financial KPIs。Revenue per processed document:$1–25。Cost per processed document:$0.20–5。Contribution margin per document:60–80%。Customer concentration:通常较高(regulated industries cluster)。NRR:115–135%(volume expansion)。
Worked unit economics。客户为每份 processed contract 支付 $5。AI compute + supporting cost:$1.20。Allocated overhead:$0.30。Contribution margin:($5 − $1.50) / $5 = 70%。一个每月 50,000 documents 的客户产生 $250K revenue 和 $175K gross profit。
5. Voice Agent
Use cases。Inbound call handling、outbound voice campaigns、appointment setting、voice-based customer service。
Typical pricing。Per-minute 或 per-call,有时是 Per-Outcome(per resolved call)。
Operational KPIs。Containment rate(call resolved without human transfer):30–70%。Conversation quality score(human rating):4.0–4.5/5。Average call duration:1–5 minutes(更长通常表示 inefficiency 或 complex issue)。Latency to first response:below 800ms。Speech recognition accuracy:above 95%。Customer hang-up rate(frustration indicator):below 8%。
Financial KPIs。Revenue per minute 或 per call:$0.25–2.50/minute 或 $1–15/call。Cost per minute(ASR + LLM + TTS):$0.10–0.40。Gross margin per call:50–70%(因 voice infrastructure 低于 text)。Concurrent call capacity:capacity-planning metric。LTV/CAC:5–15x。
Worked unit economics。$1.50/minute。Compute cost:$0.55/minute。Voice infrastructure:$0.10。Contribution margin:($1.50 − $0.65) / $1.50 = 57%。一个 10,000-minutes/month 客户产生 $15K revenue 和 $8.5K gross profit。
6. Search & Retrieval AI Worker
Use cases。Enterprise search、knowledge bases 上的 semantic Q&A、RAG-powered assistants、document discovery。
Typical pricing。Per-Seat(knowledge worker subscription)或高 volume use cases 的 Per-Query。
Operational KPIs。Retrieval precision(top 5 中 relevant docs):70–90%。Answer accuracy(vs. ground truth):75–90%。Query latency(p95):below 3 seconds。Citation accuracy(cited source actually supports the claim):above 90%。User satisfaction(thumbs up rate):70–85%。Appropriate refusal rate(AI 说 "I don't know"):5–15%。
Financial KPIs。Revenue per seat:$30–150/month。Compute cost per seat:$8–40/month。Gross margin per seat:60–75%。Index/storage cost per customer:$200–2,000/month,取决于 data volume。NRR:105–125%。
Worked unit economics。$80/month per seat。Compute(queries + index):$25。Storage:$5。Contribution margin:($80 − $30) / $80 = 62.5%。一个 500-seat 客户产生 $40K MRR 和 $25K gross profit MRR。
7. Claims Processing AI Worker
Use cases。Insurance claims adjudication、healthcare prior authorization、expense report processing。
Typical pricing。Per-Outcome(per processed claim)或 Value-Based(recovered/avoided costs 的百分比)。
Operational KPIs。Auto-adjudication rate(claims processed without human review):40–75%。Decision accuracy(vs. expert audit):above 96%。Time to decision:30 seconds–5 minutes(vs. human 15–60 min)。Appeal/reversal rate:below 5%。Compliance violation rate:must be 0%。False-approval rate(incorrect approvals):below 1%。
Financial KPIs。Revenue per processed claim:$5–50(simple 更低、complex 更高)。Cost per processed claim:$1–10。Contribution margin per claim:65–85%。Volume-driven NRR:customers scale processing 后为 120–150%。Sales cycle length:6–18 months(regulated industry)。
Worked unit economics。$12 per processed claim。AI cost:$2.50。Compliance/audit infrastructure:$0.80。Contribution margin:($12 − $3.30) / $12 = 72.5%。一个每月 100K-claims 的客户产生 $1.2M revenue 和 $870K gross profit。
8. Meeting Summarization AI Worker
Use cases。Automatic meeting notes、action-item extraction、decision documentation、CRM update automation。
Typical pricing。Per-Seat(subscription),通常作为更大 product 中的 feature。
Operational KPIs。Coverage(captured decisions/action items 百分比):80–95%。Accuracy(captured items 正确归属百分比):90–98%。Hallucination rate(fabricated decisions/actions):below 2%。Speaker attribution accuracy:above 85%。Processing time(relative to meeting duration):0.1–1×(快于 real-time)。User edit rate(需要 edits 的 summaries 百分比):below 30%。
Financial KPIs。Revenue per seat:$10–40/month(常作为 bundled feature)。Compute cost per seat:$3–15/month。Gross margin per seat:65–80%。Activation rate(seats with monthly use):60–80%。Standalone vs. bundled revenue split:单独追踪。
Worked unit economics。$20/month per seat(如果 standalone)。Compute:$7。Allocated overhead:$1.50。Contribution margin:($20 − $8.50) / $20 = 57.5%。一个 2,000-seat 客户产生 $40K MRR 和 $23K gross profit MRR。
9. Marketing Content AI Worker
Use cases。Blog post generation、ad creative variants、email campaigns、social media content、SEO content optimization。
Typical pricing。Per-Seat 或 Per-Generated-Output(per piece of content)。
Operational KPIs。Acceptance rate(as-generated 或 minor edits 后使用的 content):30–60%。Content quality score(human-rated):3.5–4.5/5。SEO performance(rankings achieved):use-case specific。Brand-voice consistency:rated on-brand above 85%。Throughput:10–500 pieces of content per hour。Originality score:above 90%。
Financial KPIs。Revenue per seat:$50–500/month。Compute cost per seat:$15–100/month(随 content volume 大幅变化)。Gross margin per seat:60–75%。Customer churn(该 category 很重):SMB 每月 8–15%。LTV/CAC:3–8x(因 churn 更高而较低)。
Worked unit economics。$200/month per seat。Compute(约 500 pieces/month):$60。Infrastructure:$10。Contribution margin:($200 − $70) / $200 = 65%。一个 100-seat agency customer 产生 $20K MRR 和 $13K gross profit MRR。
10. Legal Research AI Worker
Use cases。Case-law research、contract analysis、regulatory compliance checking、legal drafting。
Typical pricing。Per-Seat(attorney subscription),premium pricing。
Operational KPIs。Citation accuracy(cited cases 确实存在并支持 argument):above 95%。Hallucination rate(fabricated cases or citations):MUST be below 0.5%。Research completeness(relevant precedent 覆盖):80–95%。Time saved per research task:30 minutes–4 hours。Confidence calibration:must be conservative(over-estimate uncertainty)。Domain-specific accuracy:随 practice area 变化。
Financial KPIs。Revenue per attorney seat:$200–2,000/month(premium pricing)。Compute cost per seat:$50–300/month。Gross margin per seat:70–85%。Customer concentration:通常很高(large law firms)。NRR:105–120%。
Worked unit economics。$800/month per attorney seat。Compute:$180。Index/data:$40。Contribution margin:($800 − $220) / $800 = 72.5%。一家 200-attorney firm 产生 $160K MRR 和 $116K gross profit MRR。
11. Recruiting AI Worker
Use cases。Candidate sourcing、resume screening、outreach automation、interview scheduling、candidate engagement。
Typical pricing。Per-Seat(recruiter subscription)或 Per-Hire(outcome-based)。
Operational KPIs。Sourcing precision(符合 criteria 的 candidates):60–80%。Outreach reply rate:15–35%(高于 sales,因为 candidates 更关心)。Interview-to-hire conversion:15–35%。Bias mitigation score:must be tracked and reported。Throughput:每位 recruiter 每周 50–500 sourced candidates。Diversity outcomes:must be tracked and reported。
Financial KPIs。Revenue per seat:$200–1,500/month。Per-hire pricing alternative:first-year salary 的 5–25%。Gross margin:60–75%。Time-to-fill metric(operational,驱动 customer success):below 30 days。Customer concentration:通常 diversified。
Worked unit economics。$600/month per recruiter seat。Compute + data:$130。Contribution margin:($600 − $130) / $600 = 78%。一个 50-seat HR-tech 客户产生 $30K MRR 和 $23K gross profit MRR。
12. Financial Analysis AI Worker
Use cases。Earnings analysis、portfolio research、financial modeling、M&A analysis、equity research。
Typical pricing。Per-Seat(analyst subscription),high-value、premium pricing。
Operational KPIs。Calculation accuracy:must be above 99%。Source citation accuracy:above 95%。Hallucination rate on financial data:must be below 0.5%。Confidence intervals on predictive outputs:must be calibrated。Latency for complex analysis:below 60 seconds。Domain coverage(asset classes、geographies):use-case specific。
Financial KPIs。Revenue per analyst seat:$500–5,000/month(high-value analysts)。Compute cost per seat:$100–500/month。Gross margin per seat:75–88%。Customer concentration:very high(集中在 financial services)。NRR:110–130%。
Worked unit economics。$2,000/month per seat。Compute:$300。Data feeds:$200。Contribution margin:($2,000 − $500) / $2,000 = 75%。一个 50-analyst hedge fund 产生 $100K MRR 和 $75K gross profit MRR。
Consolidated benchmarks table
下面是一张单一参考表,按阶段列出最常追踪的 AI-native metrics 的健康区间。用它 sanity check 你自己的 numbers。NM = "not yet meaningful at this stage"。
关于下表的置信度说明。 SaaS-derived metrics(LTV/CAC、CAC payback、NRR、GRR、Burn Multiple、Magic Number、Rule of 40)属于 [Industry benchmark],在 SaaS finance literature 中被广泛引用,并且在 subscription businesses 中被充分验证。AI-native-specific metrics(compute as % of revenue、AI Worker cost-per-outcome decay、pilot-to-production conversion、cohort gross margin trend、compute concentration)属于 [Emerging pattern],在 2024–2026 年多家 AI-native 公司中被观察到,但仍在演化。所有 targets 的 stage-specific calibration(哪个阶段适用哪个 range)属于 [Author thesis]。
| Metric | Layer | Pre-revenue (Seed) | Early ($1–5M ARR) | Mid ($5–25M ARR) | Scaling ($25M+ ARR) |
|---|---|---|---|---|---|
| ARR | 3 | <$1M | $1–5M | $5–25M | $25M+ |
| ARR growth (YoY) | 3 | NM | 200%+ | 100–200% | 50–120% |
| Gross margin | 3 | NM | 50–70% | 60–75% | 65–78% |
| Compute as % of revenue | 3 | NM | 25–50% | 20–35% | 15–30% |
| NRR | 3 | NM | 105–125% | 115–135% | 120–140% |
| GRR | 3 | NM | 85–95% | 90–95% | 92–96% |
| CAC payback period | 2 | NM | <24 months | <18 months | <14 months |
| LTV/CAC | 2 | NM | 3–8× | 5–12× | 5–15× |
| Burn Multiple | 4 | NM | <2.5× | <2.0× | <1.5× |
| Magic Number | 4 | NM | 0.5–1.0 | 0.8–1.5 | 0.7–1.2 |
| ARR per employee | 4 | NM | $100–200K | $150–300K | $200–400K |
| R&D as % of revenue | 4 | NM | 50–70% | 35–55% | 25–40% |
| S&M as % of new ARR | 4 | NM | 100–150% | 80–120% | 70–100% |
| G&A as % of revenue | 4 | NM | 15–25% | 10–18% | 8–14% |
| Rule of 40 | 4 | NM | aspirational | 20–30% | 30%+ |
| Capital efficiency ratio | 4 | NM | 0.2–0.5× | 0.5–1.2× | 1.0–2.0× |
| Cash runway | 3 | 18–24 months | 18–24 months | 18–24 months | 18–24 months |
| Compute concentration (top provider) | 3 | NM | <90% | <80% | <70% |
| Pilot-to-production conversion | 3 | NM | 40–60% | 55–70% | 65–80% |
| Cohort gross margin trend (YoY) | 3 | NM | flat to +5pts | +3 to +8pts | +3 to +6pts |
| Bookings/recognized revenue ratio | 3 | NM | 1.0–1.5× | 1.0–1.4× | 1.0–1.3× |
| Outcome attribution accuracy (if outcome-priced) | 1 | NM | >90% | >95% | >97% |
| AI Worker cost-per-outcome decay (YoY) | 1 | NM | 20–40% | 20–40% | 15–35% |
低于下界或高于上界,并不自动意味着坏;但它是一个信号,说明有具体事项需要解释。Metrics 持续落在 ranges 之外的公司,要么业务上有某种独特之处(好或坏),要么 measurement 有问题。下一小节 diagnostic playbooks 给出 metric 偏离时应执行的标准调查集合。
Diagnostic playbooks
当某个 metric 不对时,问题是先调查什么。下面的 patterns 覆盖十种最常见 metric deviations,以及每种的标准 investigation sequence。每条都采用相同结构:symptom、most likely causes、first three investigation steps。
Burn Multiple > 2.5× and rising。 Likely causes:(1)S&M efficiency 下降(CAC 上升或 NRR 下降);(2)gross margin compression 侵蚀每客户 contribution;(3)opex 增长快于 revenue。Investigation steps:按 acquisition month 运行 cohort analysis,找出新 cohorts 是否弱于旧 cohorts;把 Burn Multiple 分解为 S&M-efficiency 和 non-S&M-burn components;review 过去 6 个月 headcount additions 与 revenue contribution 的关系。
NRR below 100%。 Likely causes:(1)existing customers 的 downsell pressure;(2)renewal cohorts 中的 churn;(3)pricing decisions 降低 per-customer revenue。Investigation steps:分离 gross retention 和 expansion,找出来源;review churn cohort 识别 common attributes;review 过去 12 个月 pricing changes 是否有 unintended consequences。
Gross margin declining quarter-over-quarter。 Likely causes:(1)compute costs 增长快于 revenue;(2)heavy users 的 share 不成比例增长;(3)sales process 中 discount discipline 松动。Investigation steps:按 cohort 看 compute-cost-per-active-customer trend;price-realization analysis(list price vs. realized price);按 AI Worker 看 compute-cost-per-outcome trend。
CAC payback above 18 months at $5M+ ARR。 Likely causes:(1)S&M spend 超过 LTV potential;(2)targeting wrong customer segment;(3)sales cycle 变长。Investigation steps:per-segment unit economics decomposition;sales-cycle trend analysis(last 8 quarters median cycle length);按 segment 和 channel 的 win-rate analysis。
High Layer 1 outcome rate but low Layer 3 gross margin。 Likely causes:(1)相对于 delivered value 定价过低;(2)per outcome compute costs 太高;(3)overhead allocation 吸收 margin。Investigation steps:per-outcome unit economics decomposition(revenue、compute、supporting costs);把 per-outcome pricing 与 comparable workers benchmark;review 什么进入 COGS、什么进入 opex(misclassification risk)。
Bookings significantly higher than recognized revenue。 Likely causes:(1)outcome-based contracts 主导 bookings;(2)ASC 606 下 variable-consideration constraints 限制 recognition;(3)implementation timing 造成 recognition lag。Investigation steps:与 auditor review revenue recognition policy;deferred revenue waterfall analysis;outcome attribution telemetry validation。
Cost-per-outcome flat or rising over 12 months。 Likely causes:(1)workflow drift(AI 被要求做更难的事情);(2)caching 没有按设计工作;(3)prompt regression(新 prompts 不如旧 prompts 高效);(4)model upgrades 未充分部署。Investigation steps:per-customer cost-per-outcome,隔离哪些 customers 驱动 trend;cache hit-rate analysis;prompt-token-efficiency 与 12 个月前比较。
Customer concentration above 30% in top 5。 Likely causes:(1)market segment 太窄;(2)sales targeting 太具体;(3)过度投入一个 anchor customer。Risk mitigation:diversification roadmap;top 5 的 churn-protection programs;mid-market 和 enterprise mix 的 pipeline analysis。
Compute concentration above 80% with one foundation-model provider。 Likely causes:(1)早期 product days 选了 single vendor,后来从未 revisit;(2)integration cost 阻碍 multi-provider work;(3)commercial relationship 偏向 single vendor。Investigation steps:评估 price-change exposure(provider price increase 30% 会如何影响 gross margin?);outage-exposure assessment(last 12-month provider uptime、RTO);multi-provider integration cost estimate。
R&D above 60% of revenue past Series A。 Likely causes:(1)相对阶段 over-investment;(2)engineering productivity issues;(3)正在为尚未实现的 future revenue 构建。Investigation steps:engineering output metrics(features shipped、bugs resolved、AI Worker capability improvements);per-engineer revenue contribution(如果可归因);capital-allocation framework review。
Diagnostic playbook 不会直接给你答案,它给的是调查路径。真正答案来自带着正确问题查看你自己的具体数据。成熟 finance functions 会维护一个「diagnostic library」,记录过往 investigations,帮助团队更快识别重复 patterns。
Cohort dashboard template
带 model-cost decay 的 Cohort analysis(Approach 8)是 AI-native finance function 维护的最高杠杆分析工具。下面是 cohort view template,会呈现传统 SaaS cohort analysis 错过的 dynamics。按你的业务调整 columns;重要的是结构。
Standard cohort dashboard structure:
| Cohort (acquisition Q) | Customers acquired | Q+0 | Q+1 | Q+2 | Q+3 | Q+4 | Q+5 | Q+6 | Q+7 | Q+8 |
|---|---|---|---|---|---|---|---|---|---|---|
| Q1 2024 | 25 | 100% | 96% | 92% | 88% | 88% | 88% | 88% | 84% | 84% |
| Q2 2024 | 30 | 100% | 97% | 93% | 90% | 90% | 90% | 87% | 87% | — |
| Q3 2024 | 32 | 100% | 97% | 91% | 91% | 88% | 88% | 88% | — | — |
| Q4 2024 | 35 | 100% | 94% | 91% | 91% | 89% | 86% | — | — | — |
这是标准 logo-retention cohort view。SaaS finance teams 已经做了二十年。AI-native finance 还要加入两个 view。
Revenue retention by cohort:
| Cohort | Q+0 | Q+4 (1 year) | Q+8 (2 years) | NRR Q+8 |
|---|---|---|---|---|
| Q1 2024 | $100K | $115K | $128K | 128% |
| Q2 2024 | $125K | $138K | $145K | 116% |
| Q3 2024 | $135K | $150K | — | — |
| Q4 2024 | $145K | $158K | — | — |
Gross margin by cohort(with model-cost decay decomposition):
| Cohort | Gross margin Q+0 | Gross margin today | Total improvement | Behavior contribution | Model-cost-decay contribution |
|---|---|---|---|---|---|
| Q1 2024 | 55% | 72% | +17 pts | +6 pts (usage growth, product expansion) | +11 pts (foundation-model price decay) |
| Q2 2024 | 58% | 72% | +14 pts | +5 pts | +9 pts |
| Q3 2024 | 60% | 71% | +11 pts | +4 pts | +7 pts |
| Q4 2024 | 62% | 71% | +9 pts | +3 pts | +6 pts |
Decomposition 是真正费力的部分。「Behavior contribution」要求把 compute prices 固定在 acquisition-period levels(synthetic-cost baseline),并只测量 customer behavior 造成的 margin change。「Model-cost-decay contribution」是剩余部分,即 foundation-model prices 下降带来的 margin improvement。
Decomposition 揭示战略真相。朴素读 cohort margin trend 的人会看到一家 pricing power 快速改善的公司(margins up 17 points!)。Decomposition 表明 pricing power 只温和改善(behavior 贡献 6 points),更大 driver 是 compute price decay 带来的 structural margin tailwind(11 points)。基于朴素视角做出的战略决策(假设存在并不存在的 pricing power),会不同于基于 decomposed view 的决策(认识到当 compute prices 稳定时,tailwind 会最终放缓)。
同一个 template 可以扩展到 per-customer-segment cohorts、per-AI-Worker-type cohorts 或 per-pricing-architecture cohorts。Discipline 一致;decomposition 才是价值。
Stage-specific investor diligence checklists
不同 fundraising stages 有不同 metric expectations。下面的 lists 覆盖投资人在各阶段实际会要求什么;提前准备材料会显著压缩 diligence timeline。
Series A diligence(typical raise: $5–25M)。
Investors expect:
- Last 12 months of monthly revenue (MRR/ARR) with subscription/usage/outcome breakdown
- Customer count by month, with new/churned/active flow
- Cohort retention chart (logo and revenue) for the last 4–8 cohorts
- Cohort gross margin with explicit compute breakdown
- Top 10 customers with ACV, contract length, and renewal status
- CAC by acquisition channel, blended CAC, and CAC payback period
- Burn rate trajectory by month (last 12 months)
- Capital efficiency since founding (total raised vs. current ARR)
- Forward 18-month forecast with explicit assumptions (revenue model, growth rate, hiring plan)
- Compute cost as % of revenue, with provider breakdown
- Founder team and current org chart
2026 年 Series A bar 大致是:$1–3M ARR、200%+ growth、dominant cohort 上健康的 unit economics、gross margin above 50%、early NRR above 110%。
Series B diligence(typical raise: $25–75M)。
Series A diligence plus:
- Full cohort gross margin trends with model-cost-decay decomposition
- Pilot-to-production conversion rates (if enterprise sales motion)
- Per-segment unit economics (SMB / mid-market / enterprise)
- Compute concentration analysis with multi-provider strategy
- Revenue recognition policy with auditor sign-off documentation
- ASC 606 audit trail for usage and outcome contracts
- Capital allocation framework (compute / people / customer acquisition)
- Engineering output metrics (features shipped, AI Worker capability improvements)
- Burn Multiple, Magic Number, and Rule of 40 trajectory
- Forward 24-month forecast with sensitivity analysis on compute price decay
- Detailed customer reference checks (investors will call top customers)
- Outcome attribution accuracy (if outcome-priced)
2026 年 Series B bar 大致是:$5–15M ARR、100%+ growth、Burn Multiple under 2x、NRR above 120%、gross margin above 60%,并证明 cohorts 经得起 second renewal。
M&A diligence(strategic acquisition or PE)。
Series B diligence plus:
- Audited financials for the last 2–3 years
- Quality of earnings deep-dive (typically by a Big Four accounting firm)
- Forecast accuracy track record (last 8 quarters of forecast vs. actuals)
- Detailed contract review (customer contracts, vendor contracts, employment agreements)
- Technology and IP assessment (model ownership, foundation-model dependencies, training data provenance)
- Compliance and regulatory review (data privacy, sector-specific regulations)
- Customer concentration risk with detailed contractual terms
- Compute concentration risk with foundation-model provider contracts
- Outcome attribution audit (sample-based verification of attribution accuracy)
- Tax structure review (transfer pricing, deferred revenue treatment, R&D credits)
- Working capital analysis (DSO, prepaid compute, deferred revenue waterfall)
M&A bar 会随 acquirer thesis 变化。Strategic acquirers 最关心 technology 和 customer fit;PE acquirers 最关心 cash flow 和 predictability;financial sponsors 最关心 exit pathways。
成熟 finance function 会维护 running data rooms,也就是包含各 diligence stage 所需所有材料的 folders,并每季度更新,确保「30 天内 ready」是真实状态,而不是愿望。
Compute economics deep-dive
Compute 是多数 AI-native 公司最大的 variable cost。要真正理解它的 economics,不能只看 gross-margin-percentage level,还要看到 per-unit、per-modality 和 per-provider level。这区分了表层 AI finance 和 operational AI finance。
Per-modality cost ranges(2026)。 Foundation-model 和 infrastructure pricing 会随 modality 变化。下面 ranges 是典型值而非精确值 [Author thesis: 基于 2026 年主要 providers 公开 pricing 的 snapshot;具体 provider pricing 频繁变化,任何 forecast model 前都应验证];具体 provider pricing 频繁变化,任何 forecast model 前都应验证。
| Modality | Typical cost range | Cost driver |
|---|---|---|
| Text generation (LLM API) | $0.50–15 per 1M input tokens; $1.50–75 per 1M output tokens | Model size and quality tier |
| Voice synthesis (TTS) | $0.05–0.30 per minute of generated speech | Voice quality and naturalness |
| Voice recognition (ASR/STT) | $0.02–0.20 per minute transcribed | Real-time vs. batch, language, accuracy tier |
| Image generation | $0.005–0.10 per image | Resolution, model quality |
| Video generation | $0.10–2.00 per second of generated video | Resolution, length, model quality |
| Embeddings | $0.02–0.30 per 1M tokens | Embedding dimensionality and quality |
| Fine-tuning | $50–500 per 1M tokens of training data + host compute | Model size, training method |
每个 modality 内部的宽 range 反映 tiered pricing:high-quality models 可能比 basic models 贵 5–50×。把 model tier 匹配到 use case 的公司(adequate 时用 basic models,只在需要时用 premium models),会比默认所有场景都用 premium 的公司获得实质 margin advantage。
Provider pricing comparison framework。 2026 年 compute provider 有三类,各自 pricing dynamics 不同:
Foundation-model API providers。Anthropic、OpenAI、Google、Mistral、Cohere、Together AI、Fireworks。Variable cost、no upfront commitment、prices 每年下降 30–60%。最容易的路径;margin control 最少;如果依赖单一 provider,会有 vendor concentration risk。
Hyperscaler offerings。AWS Bedrock(Claude、Llama 等)、Azure OpenAI、GCP Vertex AI。API pricing 通常与直接 foundation-model providers 类似,并增加两个好处:通过现有 cloud-vendor relationships 采购(compliance、single PO、committed-spend discounts),以及为 regulated industries 提供 regional residency options。多数情况下 per-unit cost 略高于 direct API,但 procurement 和 compliance benefits 会抵消。
Self-hosted / open-weight models。Llama、Mistral、Qwen、DeepSeek,以及部署在自有或租赁 GPUs 上的更广泛 open-weight ecosystem。Fixed cost(GPU rental 或 purchase)不随 utilization 变化;需要 utilization 高于 breakeven 才能在经济性上与 API pricing 竞争。典型 breakeven 随 workload 变化,但粗略 heuristic 是:中等 traffic workloads 在持续 50–70% GPU utilization 时 self-hosting 具备竞争力;低于 30% utilization 或 spiky workloads 时竞争力较弱。
Build-vs-buy economics for compute。 是否 self-host 或使用 foundation-model APIs,本质上是 utilization-and-volume question。数学如下:
API cost per inference = $X (variable, scales linearly)
Self-host cost per inference = (GPU hourly cost / inferences per hour at target latency) + amortized engineering cost
典型 H100 GPU 租用价格约 $2–4 per hour,并根据 model size、quantization、batching 和 latency requirements,每秒可交付 50–500 inferences。在持续 100 inferences per second(每小时 360,000 inferences)时,按 $3/GPU-hour 计算,self-hosted cost per inference 约为每次 $0.0000083,再加 engineering overhead。与可能为每次等价 inference $0.005–0.05 的 API costs 相比,高 utilization 下 self-hosting 便宜得多。在持续 10 inferences per second(low utilization)时,self-hosted cost per inference 上升到 $0.000083,仍可能低于 API,但伴随 self-hosting 的全部 operational overhead 和 capacity-planning risk。
实际决策很少纯粹是经济问题。Self-hosting 需要 small teams 通常无法交付的 engineering capability、capacity-planning discipline 和 uptime accountability。多数 AI-native 公司从 APIs 开始(lower operational burden),在 $5–15M ARR 规模评估 self-hosting(compute 足够大,engineering optimization 值得做),并在 $25M ARR 后采用 hybrid strategies(最高 volume workloads self-host,其余使用 API)。
Cost-per-modality benchmarking。 各 modality 的「good」长什么样不同。规模化且优化良好的 customer-support text agent,每张 resolved ticket 成本为 $0.20–0.40。Voice agent 每分钟 $0.30–0.70。Image generation use case 每张 image $0.01–0.05。这些 numbers 应每月追踪;偏离 benchmark 就触发 investigation(model upgrade、prompt regression、batching opportunity、caching opportunity)。
Operational health metrics for AI Workers
除了 Section E 的六个核心 operational KPIs,成熟 AI Worker monitoring 还需要一层更深的 health metrics。它们判断 AI Worker 是否 operationally trustworthy,而不只是 operationally productive。值得追踪的六个 metrics:
Drift detection rate。 输入中落在 AI Worker 设计分布之外的百分比。Drift 正常存在:customer behavior 会变,edge cases 会出现。但 rising drift 是 accuracy degradation 的 leading indicator。健康状态:5–15% inputs 检测到 drift,并对这些 inputs 做 explicit handling(escalation、low-confidence flagging)。令人担心的状态:drift below 1%(暗示 drift detection 没工作)或 above 30%(暗示 AI Worker 正在远离 design envelope 运行)。
Hallucination rate by domain。 AI Worker outputs 中 fabricated facts 的频率,并按 topic domain 分段。General assistant 可能 overall hallucination rate 只有 2%,但 legal questions 为 8%、medical questions 为 15%。按 domain 追踪能暴露哪些 use cases 不安全;aggregate-only tracking 会掩盖决定真实世界风险的 variance。
Latency distribution(p50、p95、p99)。 Mean latency 会隐藏 worst-served users 的体验。p50 为 1 秒、p99 为 30 秒,意味着 1% users 要等 30 秒,通常已经不可能产生好体验。健康状态:p99 不应超过 p50 的 3–5×;更高通常说明 capacity misprovisioned 或 queueing broken。
Prompt-injection resistance。 Adversarial inputs(试图操纵 AI 打破 rules)中,AI Worker 正确拒绝或 containment 的百分比。任何处理 untrusted user input 的 AI Worker 都必须重视。健康状态:standard adversarial-input test sets 上 above 95%,并随着 attack patterns 演化定期重新评估。
Refusal rate appropriateness。 AI Worker 正确说 "I don't know" 或 "I cannot help with this" 的频率,同时区分不恰当地拒绝合理请求,和不恰当地尝试本应拒绝的请求。两种 failure modes 要分开衡量:over-refusal(拒绝本应回答的事)和 under-refusal(尝试本不应做的事)。健康区间取决于 use case,但 calibration 应持续监控。
Evaluation-set performance trend。 对 curated evaluation set 的 performance,并随时间追踪。Models 会变(foundation-model upgrades、prompt iterations、new training data);evaluation set 是 constant ruler。Against eval set 的 trending performance 是 canonical regression-detection mechanism。下降 trend 表示 regression;应在 regression 进入 customer-facing metrics 前调查。
这六个 metrics 应与 Section E 的六个核心 KPIs 一起进入 AI Worker monitoring stack。它们给 finance、product 和 engineering 一个 shared view of operational health,也提供 early-warning system:一旦 operational health 恶化,后续 financial impacts 会随之到来。
Additional worked dashboards
Section E 的 AgentCo dashboard 覆盖了一家 $10M ARR、采用 hybrid pricing 的 mid-stage 公司。下面的 dashboards 覆盖另外三个阶段和 architectures。
Worked example: SeedAI at pre-revenue (Seed stage)
Profile。Pre-revenue AI agent company,距离 public launch 还有 4 个月。8 employees。6 个月前 raised $3M Seed。5 个 design partners 正在 beta 使用产品,尚无 commercial contracts。Pricing model 正在开发,预计以 Per-Call 上线。
Layer 1 metrics。
| Metric | Value | Notes |
|---|---|---|
| Outcome rate (in beta) | 65% | Trending up; up from 45% three months ago |
| Quality score | 3.8/5 | Improving with prompt iteration |
| Cost per outcome (in beta) | $0.85 | High; will fall as model usage matures |
Layer 2 metrics。暂时没有意义,因为还没有 commercial relationships。
Layer 3 metrics。
| Metric | Value | Notes |
|---|---|---|
| Monthly burn | $200K | Includes 8 employees + compute + infrastructure |
| Cash on hand | $1.8M | After $1.2M deployed in 6 months |
| Cash runway | 9 months | Tight; need to raise within 6 months or hit revenue |
| Compute spend | $15K/month | Beta usage by 5 design partners |
Layer 4 metrics。Pre-revenue 阶段暂时没有意义。
What this dashboard tells the team。SeedAI 是 pre-revenue,现金只够 9 个月;唯一重要的 metrics 是 runway、burn 和 lead indicators(beta engagement、quality trending up、cost-per-outcome trending down)。Quality score 从低 3 分移动到高 3 分,是最清晰的 health signal;如果 public launch 前 quality plateau,launch 会失败。团队应只关注把 outcome rate 和 quality 提升到 ship-ready levels 后再融资,并忽略其他一切。在这个阶段做复杂 KPI dashboard 的团队是在浪费精力;runway 和 quality trajectory 才是唯一重要的东西。
Worked example: ScaleAI at $50M ARR Series B (value-based pricing component)
Profile。Enterprise AI company,主要是 ABM 和 field-sales motion。$50M ARR。180 employees。12 个月前完成 Series B(raised $75M)。Pricing 是 hybrid,在 strategic enterprise customers 中有 substantial value-based engagements(5 个 value-based customers 贡献 $50M ARR 中的 $18M;其余 $32M 来自 Per-Outcome 和 Hybrid contracts)。
Layer 1 metrics。
| Metric | Value | Healthy? |
|---|---|---|
| Outcome rate (across all customers) | 81% | Yes |
| Outcome attribution accuracy | 96% | Yes (target above 95%) |
| Cost per outcome | $0.31 | Yes; fell 30% YoY |
Layer 2 metrics。
| Metric | Value | Healthy? |
|---|---|---|
| ACV (subscription customers) | $250K | — |
| ACV (value-based customers) | $3.6M | Premium pricing |
| LTV/CAC (subscription) | 7× | Healthy |
| LTV/CAC (value-based) | 12× | Strong |
| CAC payback (blended) | 16 months | Healthy |
Layer 3 metrics。
| Metric | Value | Healthy? |
|---|---|---|
| ARR | $50M | — |
| Bookings | $68M | 36% above ARR (value-based contract growth) |
| NRR | 135% | Strong |
| Gross margin | 70% | Strong |
| Compute as % of revenue | 22% | Healthy |
| Pilot-to-production conversion | 71% | Strong |
| Variable consideration recognition rate | 60% | Mid-range; trending up as track record matures |
Layer 4 metrics。
| Metric | Value | Healthy? |
|---|---|---|
| Burn Multiple | 1.2× | Strong |
| ARR per employee | $278K | Strong for AI-native at this scale |
| Rule of 40 | 45% (60% growth + (-15%) EBITDA) | Strong |
| Capital efficiency ratio | 0.50× ($50M ARR / $100M raised) | Improving |
What this dashboard tells the team。ScaleAI 是一家健康的 Series B AI-native 公司,unit economics 强,hybrid pricing strategy 有效。Value-based contracts 正在完成任务:在 strategic accounts 中以 premium pricing 集中 revenue。60% variable-consideration-recognition rate 是需要 watch 的 metric;随着 value-based contracts aging,并且 audit-defensible value calculation 成熟,这个数字应上升到 75–85%,从已签 contracts 中解锁额外 $5–10M GAAP revenue。团队应重点完成 year-1 value-based contracts 的 audit cycles,以支持 revenue recognition,同时继续在 strategic accounts 建立 value-based pipeline。
Worked example: ScaleCo at $150M ARR Series C+ (mature scaling)
Profile。Late-stage AI-native company,主要采用 Per-Outcome pricing。$150M ARR。450 employees。18 个月前完成 Series C(raised $150M)。800 customers,覆盖 mid-market 和 enterprise。准备在未来 12–18 个月进行 Series D 或 strategic alternatives。
Layer 1 metrics。(Aggregated;full per-AI-Worker reporting available internally)
| Metric | Value | Healthy? |
|---|---|---|
| Outcome rate (across all AI Workers) | 84% | Strong |
| Cost per outcome trend (YoY) | -22% | Healthy |
| Outcome attribution accuracy | 98% | Excellent |
Layer 2 metrics。
| Metric | Value | Healthy? |
|---|---|---|
| ACV (blended) | $190K | — |
| LTV/CAC | 9× | Strong |
| CAC payback | 13 months | Strong |
| Contribution margin per outcome | 74% | Strong |
Layer 3 metrics。
| Metric | Value | Healthy? |
|---|---|---|
| ARR | $150M | — |
| Bookings | $185M | 23% above ARR |
| NRR | 138% | Excellent |
| GRR | 94% | Strong |
| Gross margin | 75% | Strong (top of AI-native range) |
| Compute as % of revenue | 18% | Excellent (down from 28% two years ago) |
| Cohort gross margin trend | +4 pts/year | Strong (model-cost decay slowing) |
Layer 4 metrics。
| Metric | Value | Healthy? |
|---|---|---|
| Burn Multiple | 0.4× | Excellent |
| ARR per employee | $333K | Strong |
| R&D as % of revenue | 28% | Mature SaaS-like |
| S&M as % of new ARR | 78% | Strong |
| Rule of 40 | 50% (40% growth + 10% EBITDA) | Strong |
| Capital efficiency ratio | 0.94× ($150M ARR / $160M raised) | Strong |
What this dashboard tells the team。ScaleCo 正接近 IPO-readiness metrics。Rule of 40 above 40%、Burn Multiple under 0.5×、gross margin at 75%,都处在 public AI-native investors 会想看到的 ranges。三件事仍需要持续关注:(1)cohort gross margin trend 从两年前 +6 pts/year 放缓到现在 +4 pts/year,说明 model-cost decay 正在正常化,团队应规划用 product-side levers(efficiency engineering、pricing power)继续推动 margin growth,而不是依赖 structural tailwind 持续;(2)R&D at 28% 可能会随公司 scale 继续压缩,团队应规划哪些 capabilities 保持 in-house,哪些通过 partnerships 获得;(3)公司已经有 metrics 支持 premium valuation 的 Series D 或 strategic alternatives(acquisition、IPO preparation),战略问题是哪条路径能为 stakeholders 产生最佳 risk-adjusted outcome。
这三个 dashboards 合在一起展示了不同阶段 metric priorities 如何变化。SeedAI 关心 runway 和 quality。ScaleAI 关心 cohort behavior、value-based contract maturation 和 Burn Multiple discipline。ScaleCo 关心 Rule of 40、capital efficiency 和 IPO-readiness benchmarks。同一套 framework 适用于三者;真正重要的 specific metrics 会随阶段而变。
横向概念
The compute-as-COGS reality。 传统 SaaS 把 hosting costs 看成 income statement 的小脚注。AI-native finance 把 compute 视为 primary line:它通常是最大的 variable cost,有时占收入 30–60%。这一个差异会层层影响 finance 的每个方面:gross margin definitions、pricing architectures、forecast complexity、capital allocation、investor reporting。从传统 SaaS 来的创始人,如果把 compute 当成 hosting-equivalent line item,会系统性误判业务。
Bookings vs. recognized revenue。 在 subscription SaaS 中,bookings(signed deals 的合同价值)和 recognized revenue(P&L 上的 GAAP revenue)紧密同步:recognized revenue 等于 bookings 除以合同期限,并按月确认。在有 usage- 或 outcome-based contracts 的 AI-native 公司中,两者会明显分离。一家公司可能有 $10M signed bookings,但只有 $4M recognized revenue,因为大部分合同是 outcome-based,收入确认在 outcomes delivered 前受到约束。投资人和董事会必须学会同时读两个数字;只展示其中一个会产生误导图景。
Model-cost decay as a margin tailwind。 AI-native 公司拥有传统 SaaS 没有的 structural margin tailwind:foundation-model prices 每年下降 30–60%,因此今天获得的 customers,在 2028 年的服务成本会低于现在。这会影响 pricing decisions(未来有降价空间)、CAC payback acceptable thresholds(cohort 会随时间更赚钱,所以更长 payback 可接受),以及 capital allocation(margin tailwind 会与 revenue growth 一起成为 margin driver)。忽视这个动态的公司,会比明确建模它的公司做出更差决策。
The pilot-to-production conversion gap。 Enterprise AI deals 通常先签 paid pilots,再签 production contracts。Conversion rate 显著低于 100%,成熟公司典型为 50–75%。Pilot revenue 和 production ARR 的经济特征不同;混在一起会产生误导性的财务图景。分别报告它们的 discipline 很直接,但经常被忽视,尤其是在 fundraising 时存在 inflate ARR 的诱惑。
Outcome attribution as an audit risk。 Per-outcome pricing 需要 audit-grade telemetry 来 defend 每个 billable event。没有它,客户争议会把 revenue collection 变成谈判。审计师检查 outcome-based contracts 时,越来越多地要求把 attribution telemetry 作为 revenue-recognition support。运行 outcome-based contracts 却没有 disciplined attribution 的公司,会在年终遇到 audit comments,并可能出现 revenue restatements。
Compute concentration risk。 AI-native 公司经常依赖一个或两个 foundation-model providers 来承担大部分 compute。Anthropic 和 OpenAI 上 90% concentration 会产生传统 SaaS 不面对的 vendor risk。投资人越来越常问 concentration;成熟公司把它作为 tracked metric 报告,并维护 multi-provider strategies,即使平时没有启用。
AI 改变每个 finance discipline 的地方
五个变化贯穿这些 approaches,值得明确命名。
1. Gross margin redefined。 传统 SaaS 预期 75–85% gross margins;AI-native gross margins 通常为 50–70%。15–25 percentage point gap 主要来自 compute。用传统 SaaS norms benchmark AI-native 公司的投资人和 acquirers 会得出误导结论;合适比较是「包含 compute 的 AI-native gross margin」对「包含 compute 的 AI-native gross margin」,而不是对 pure-software comparables。
2. Forecasting under continuous price decay。 传统 SaaS forecasts 假设 unit costs 稳定。AI-native forecasts 必须明确建模 compute price decay(主要 model providers 通常每年 30–60%)。没有这一层,forecasts 会系统性低估 out-quarter margins,并产生误导性 runway projections。
3. Revenue recognition complexity at smaller scales。 传统 SaaS revenue recognition 在任何 scale 都简单,因为合同结构统一。AI-native 公司在远小于 SaaS norms 的收入规模上,就会遇到 revenue-recognition complexity(variable consideration、multiple performance obligations、outcome-dependent payments)。一家 $5M ARR AI-native 公司,经常面对 comparable-revenue SaaS 公司到 $50M 才会遇到的 revenue-recognition questions。
4. The pilot-to-production motion as standard。 传统 enterprise SaaS 直接销售 annual contracts。Enterprise AI 先卖 pilots,再转 production contracts。这个 two-stage commercial structure 产生传统 SaaS 不面对的 accounting complexity(如何 recognize pilot revenue、如何 forecast pilot conversion)。
5. The new role: AI Finance Engineer。 AI-native finance teams 越来越多地包含传统 SaaS 没有的 function:一位 engineer 或 data scientist,负责构建 cohort analysis、compute attribution、outcome attribution 和 forecast modeling 的 data infrastructure。类似 Sales Catalog 中的 AI Outcome Engineer,这个角色让 investor reporting 中的 Tier 2 metrics 变得可能。没有这个角色的公司,是在用传统 SaaS tooling 运行 AI-native finance,报告会错过 AI-native dynamics。
常见 hybrid models
多数 AI-native 公司不会运行单一 architecture;它们会运行随规模演化的组合。五种常见 hybrid evolution paths 足够反复出现,值得命名。
Per-Call (2) → Per-Call + Subscription (5)。 公司从纯 usage-based pricing 起步(典型于 AI infrastructure 和 developer-buyer products),并在 scale 后加入 subscription floor,从而产生更可预测 revenue,并缓解 bill-anxiety problem。这个 transition 通常发生在 $5–10M ARR,当投资人对 predictability 的压力开始超过纯 usage 架构的简单性时。
Per-Seat (1) → Per-Seat + Usage Overage (5)。 公司从传统 Per-Seat SaaS 起步(典型于 AI-augmented productivity tools),并在 compute costs 威胁 heavy users margin 时加入 usage overages。这个 transition 通常发生在 compute share of revenue 超过 15% 时,说明纯 Per-Seat 已不可持续。
Per-Seat (1) → Per-Outcome (3)。 更剧烈的演化:从 AI feature 的 subscription pricing 起步的公司,会意识到 AI 正在做 labor-replacement work,于是把 AI-specific functionality 转为 outcome-based pricing,同时通常保留 surrounding workflow 的 Per-Seat。这通常需要重新谈判 customer contracts,并在 AI 正在做 high-value work 的客户上带来显著 revenue uplift。
Pilot (Approach 9) → Production Contract。 标准 enterprise AI commercial sequence:paid pilot → production contract。对任何运行 enterprise sales motion 的公司,accounting 和 reporting transition 都是标准模式。没有 formalize 这一演化的公司,通常会 misforecast revenue。
Per-Call (2) → Per-Outcome (3) for specific workflows。 运行 Per-Call infrastructure pricing 的公司,会识别 outcome-based pricing 能产生显著更高 revenue 的 specific workflows(通常 revenue per call 高 3–10x)。它们把这些 workflows 转为 outcome pricing,同时其余部分保留 Per-Call。这会产生 hybrid pricing structure,在 AI 做 labor-replacement work 的地方捕获更多 value。
这些 hybrids 不是唯一配置。多数成功 AI-native 公司运行其中一个或多个 recognizable variants。
常见财务失败模式
八种 failure patterns 出现得足够频繁,值得命名。能在自身运营中识别这些模式的 finance leader 可以修复;识别不了,就会反复以同样方式输掉。
Compute-as-hosting misclassification。 团队把 compute 当成传统 SaaS 的 hosting:P&L 上的小脚注,并没有把它作为 investor reporting 中的 primary cost line 浮现出来。投资人把公司与传统 SaaS norms 比较时,会得出误导结论。修复方法是把 compute 作为 COGS 中的 distinct line item 报告,并每季度明确计算 compute-as-percentage-of-revenue。
ARR inflation through pilot inclusion。 团队在 fundraising 时把 paid-pilot revenue 计入 ARR figures。Sophisticated investors 在 diligence 中发现后失去信任。修复方法是在所有 materials 中把 pilot revenue 与 ARR 分开报告,并明确披露 conversion rate。
Aggressive revenue recognition that auditors restate。 公司在 usage- 或 outcome-based contracts 中,基于对 variable consideration 的乐观假设确认收入。年末 auditors 不同意;revenue 向下 restated;投资人失去信心。修复方法是在签第一份 non-subscription contract 前聘请有 AI 经验的 revenue accountants,正式记录 recognition policy,并在第一次 audit cycle 中与 auditors review。
Compute commitment overcommitment。 团队为了折扣价格承诺大额 prepaid compute purchases,随后 customer growth 低于 forecast。Committed compute 闲置;prepaid asset 变成 financial drag。修复方法是基于 demonstrated demand 保守 sizing compute commitments,而不是基于 optimistic forecasts。
Cohort analysis without model-cost decay separation。 团队追踪 cohort retention 和 revenue,却不追踪带 explicit model-cost-decay decomposition 的 gross margin trends。朴素 cohort margins 看起来像是因 customer behavior 改善;实际改善主要来自 compute-price decay。战略决策基于错误 attribution。修复方法是建立 synthetic-cost baseline,并明确分解 margin trends。
Forecasting with constant compute prices。 团队构建 12–24 个月 forecasts,假设 compute costs 保持在当前 percentage-of-revenue levels。Forecasts 系统性低估 out-quarter margins;runway projections 过度保守;strategic options 被错过。修复方法是在 forecast model 中加入 explicit compute-price-decay layer,并使用多个 scenarios。
Premature CFO hire。 团队在 $2M ARR 时雇 CFO,期待 CFO「professionalize finance」。CFO 到任后为 $50M 公司搭建 infrastructure,烧掉本可支持 growth 的资本。修复方法是在公司达到 $10M+ ARR 且有 complex contract structures 前,使用 fractional CFO 或 experienced controller;在这个 scale 前 full CFO hires 通常毁掉的 value 比创造的更多。
Investor reporting heavy on bookings, light on cash。 团队报告漂亮的 bookings figures 和 total contract value,却弱化 cash runway 和 recognized revenue。锚定 cash flow 和 GAAP revenue 的投资人,会得出与团队叙事不同的结论。修复方法是以 cash 和 recognized revenue 为 reporting 起点;再用 bookings 作 context。
AI-native finance anti-patterns
AI 时代财务中还有五个额外陷阱。
Treating model spend as fixed infrastructure。 团队与 foundation-model provider 谈成 fixed-fee enterprise compute deal,然后不管实际 usage 如何,都把这个 fixed cost 用到每个客户上。Heavy users 被 light users 交叉补贴;按客户的 unit economics 变得不透明。修复方法是即使底层合同是 fixed-fee,也要用能追踪 per-customer consumption 的 metering infrastructure,把 compute costs 归因到具体 customers 和 workflows。
Ignoring compute concentration risk。 团队 90%+ compute 依赖单一 foundation-model provider,却把它当成非问题。Provider 提价、outage 或修改 terms;公司没有 fallback。修复方法是维护 multi-provider integrations,即使正常运营中不启用;主动监控 provider terms changes,并在 board materials 中报告 concentration risk。
Pricing based on cost rather than value。 团队基于 compute cost 的 markup(cost-plus pricing)给产品定价,而不是基于 AI 为客户创造的 value。这样会把大量 revenue 留在桌面上,尤其在 outcome-based 和 value-based architectures 中,价值可能是成本的很多倍。修复方法是把 pricing 锚定在 customer value(labor cost replaced、revenue generated、costs avoided),而不是 seller cost。
Forecasting without model-improvement scenarios。 团队预测 revenue 时假设当前 AI capability 保持不变。六个月后,foundation models 显著改善,公司产品能力增强,forecast 在任一方向上都可能明显错误(更好产品推动更多 usage,或竞争产品 commoditize offering)。修复方法是在 forecast 中加入 capability-improvement scenarios,明确建模如果 foundation models 在未来 12 个月能力提升 2x,会发生什么。
Building Tier 2 metrics retroactively。 团队等到 Series B fundraise 时才构建 cohort analysis with model-cost decay、outcome-attribution accuracy tracking 和 forecast-accuracy reporting。Data infrastructure 不存在;metrics 只能从不完美历史数据中 retroactively estimated;投资人察觉不精确并失去信心。修复方法是在 metrics 被需要前就构建 data infrastructure,AI Finance Engineer 角色正是为此存在。
最小可行 finance stack 与阶段建议
多数 AI-native 创始人在前 18 个月不需要成熟 finance function。下面是 minimum viable stack 和 stage-by-stage prescriptions。
Minimum viable finance stack(Pre-revenue through Early Traction)。
能为早期 AI-native B2B 公司产生 defensible operation 的最小 finance practices 集合:
-
Stripe(或等价工具)for billing — start month 1。 处理 subscription invoicing、usage metering 和 payment collection。成本是 collected revenue 的百分比。多数 AI-native 公司使用 Stripe;替代方案包括 Paddle、Chargebee 和新兴 AI-native billing tools。
-
Pilot、Bench 或 Puzzle for bookkeeping — start month 1。 Monthly close、basic financial statements、tax preparation。成本为 $200–$1,500/month。至少到 Series A 前,都能免去 in-house bookkeeper 的需求。
-
Mercury 或 Brex for banking and treasury — start month 1。 与 bookkeeping tools 集成的现代 banking infrastructure。小规模时成本免费或很低。
-
Three numbers tracked weekly — start month 1。 Revenue、gross margin、runway。从 bookkeeping tool 更新。展示在创始人看得见的地方。
-
Quarterly forecast spreadsheet — start month 6。 简单的 18-month projection,预测 revenue 和 burn。每季度初更新;与 actuals 比较。
-
External auditor relationship — start at Series A diligence。 为第一次 audit cycle 识别一家有 AI-native 经验的 CPA firm。多数公司到 Series B 前不需要 formal audit;Series A 典型是「audit equivalent」Quality of Earnings review。
这就是完整 minimum viable stack。阶段不需要之前,跳过其余部分。
Stage-based recommendations。
| Company stage | Primary finance practices | Avoid for now |
|---|---|---|
| Pre-revenue (Seed) | Stripe + Pilot/Bench/Puzzle, three numbers tracked weekly, simple runway forecast | CFO hire, FP&A software, formal audit, complex revenue recognition policies |
| Early revenue ($1M–$5M ARR) | Add controller (fractional or full-time), monthly board reporting basics, formal revenue recognition policy | CFO hire, custom FP&A platform, sophisticated cohort analysis |
| Scaling pre-Series B ($5M–$15M ARR) | Add VP Finance or senior controller, formal monthly close, basic cohort analysis, AI Finance Engineer role | CFO unless preparing for IPO trajectory, complex multi-entity structures |
| Post-Series B ($15M+ ARR) | CFO, full FP&A team, sophisticated cohort analysis with model-cost decay, audit-defensible outcome attribution | Premature IPO preparation infrastructure |
最常见 founder mistake 是太早雇 CFO。这个角色的价值随公司复杂度增长而增长;$3M ARR 的 CFO 事情太少,却会烧掉本可支持 growth 的资本。正确顺序是:创始人做账 → fractional controller → full-time controller → VP Finance → CFO,并且 transitions 应绑定 revenue stage 和 complexity,而不是 title appeal。
如何使用本目录
给把这份文档作为 planning tool 阅读的读者三条收尾指令。
第一,不需要运行每一种 approach。 多数成功 AI-native 公司会使用两到四种 pricing architectures(通常一个 primary 加一两个 complements),普遍应用 revenue and cost mechanics,逐步发展 planning approaches,并用适合自身阶段的 metrics 对外报告。使用 Finance Diagnostic 和 Strategic Fit Matrix 缩小候选范围。
第二,排序比完美更重要。 一家公司前三年把基础做好(Per-Call 或 Per-Seat pricing、Stripe + bookkeeping、追踪三个数字、简单 forecast),比从第一天就搭建 elaborate finance infrastructure 的公司更可能获得长期 financial health。基础会 scale;infrastructure 会反复拆掉重建。
第三,AI 时代奖励能工程化自有 data infrastructure 的 finance functions。 五年前,finance teams 可以依赖标准 SaaS metrics 和标准 formats。2026 年,重要的 metrics:cohort margin with model-cost decay、outcome attribution accuracy、compute concentration、forecast accuracy under price decay,都需要 out-of-the-box 不存在的 custom data infrastructure。能赢的公司,是那些足够早雇 AI Finance Engineers(或把 engineers 分配给 finance),在 infrastructure 被需要前就把它建好的公司。
初学者常见问题
下面是一份非穷尽清单,列出初学者读完本目录后常问的问题。
"How is AI-native finance different from regular SaaS finance?"
三个结构性差异。第一,gross margins 是 50–70%,而不是 75–85%,因为 compute 是成本中的重要部分。第二,pricing 经常是 usage-based、outcome-based 或 hybrid,而不是纯 subscription,这会让 revenue recognition 更复杂。第三,forecasting 必须明确建模 compute-price decay(foundation models 每年 30–60%),传统 SaaS forecasts 会忽略它。除此之外,财务 mechanics 相同:debits and credits 一样,ASC 606 适用于所有 software companies,基础 SaaS metrics 仍然重要。
"Do I need a CFO?"
至少到 $10M ARR 前不需要,很多时候到 $25M+ 才需要。过早 CFO hires 毁掉的 value 比创造的更多。在公司具备真正需要 full-time strategic finance leader 的运营复杂度前,先使用 fractional CFO 或 experienced controller。
"What's the difference between bookings and recognized revenue?"
Bookings 是 signed deals 的 contractual value(例如一份 $1.2M 一年期合同,在签署当天就是 $1.2M bookings)。Recognized revenue 是公司按合同履约时进入 P&L 的 GAAP revenue(同一份合同例如按 12 个月确认,每月 $100K)。对传统 SaaS,两者紧密同步。对有 usage- 或 outcome-based contracts 的 AI-native 公司,两者会明显分离;早期 periods 中 bookings 可能是 recognized revenue 的 2–5x。
"How should I think about gross margin for an AI company?"
计算时把 compute 作为 COGS line 纳入。AI-native gross margins 为 60–70% 属于健康;低于 50% 是 warning sign,说明 pricing 或 cost structure 有问题。不要用传统 SaaS norms(75–85%)benchmark;这个比较会误导。
"When should I worry about revenue recognition?"
从签第一份合同的那一刻开始。ASC 606 从第一天适用。复杂度随 contract structure 扩张:pure subscription(Per-Seat 或 Per-Call)简单;outcome-based 和 value-based contracts 复杂到需要有 AI 经验的 revenue accountant。
"How do I forecast revenue when so much is unpredictable?"
用两层构建 forecast:customer revenue(按 cohort,建模 retention 和 expansion)和 compute costs(明确 decay-rate scenarios)。把两者结合,预测 gross margin。运行 sensitivity analysis。向董事会展示 base case 和 conservative case。不要假装拥有不存在的 certainty。
"What metrics should I report to my board?"
Tier 1(canonical SaaS):ARR、NRR、gross margin、Burn Multiple、runway。Tier 2(AI-specific):compute-as-percentage-of-revenue、cohort gross margin trend、pilot-to-production conversion、bookings vs. recognized revenue。Tier 3(strategic):compute concentration risk、forecast accuracy、capital allocation breakdown。多数 pre-Series-A 公司只需要 Tier 1;Series A 后应逐步加入 Tier 2;Series B 后应报告全部三层。
"What if I'm a solo founder with no finance background?"
你只有一个任务:诚实地每周查看 revenue、gross margin(revenue minus compute and direct costs)和 runway。使用 Stripe + Pilot 或 Bench + Mercury。跳过其他一切。融资时,在 diligence 期间雇一个 fractional controller。其余 finance 等到你有 $5M+ ARR 后再做。
Appendix A: Glossary
ARR (Annual Recurring Revenue)。 Subscription contracts 的 annualized contracted revenue。对带 usage-based components 的 AI-native 公司,"ARR" 通常指 subscription components 加上 recurring usage revenue 的 normalized estimate。(见 Common motion failures — ARR inflation 中的 pilot-inclusion failure mode。)
ASC 606。 美国 revenue recognition 会计准则(Accounting Standards Codification Topic 606, "Revenue from Contracts with Customers"),由 FASB 发布。它定义收入确认的五步框架。(见 Approach 6。)
Audit defensibility。 账本经受 auditors、investors 和 acquirers 审查的能力。五个 financial pillars 之一。
Bookings。 Signed deals 的 contractual value,不管 revenue 何时确认。对有 usage- 或 outcome-based contracts 的 AI-native 公司,它与 recognized revenue 明显不同。(见 Approach 6。)
Burn Multiple。 Cash burned 与 net new ARR 的比率,由 David Sacks 推广。越低越好。SaaS norms:under 1.5x 属于健康;AI-native norms:under 2.0x 对 early-stage growth-mode companies 可接受。
CAC (Customer Acquisition Cost)。 获取一个新客户的 fully-loaded cost。(见 Marketing Catalog Motion 5;Sales Catalog cross-cutting concepts。)
CAC payback period。 客户的 gross-margin contribution 偿还获取该客户 CAC 所需时间。成熟 SaaS norms:18 个月或更少;AI-native 公司因 model-cost decay tailwind,往往可接受更长。
Capital allocation。 如何在 compute、people、customer acquisition 和 runway 之间分配 incremental dollars 的战略问题。(见 Approach 11。)
Capital efficiency。 每部署一美元资本产生的 revenue。由 Burn Multiple 和 Magic Number 等 metrics 捕捉。五个 financial pillars 之一。
Cash runway。 在 current burn rate 和 current cash 下,公司能支撑多少个月运营。早期公司最基础的 finance metric。
Cohort analysis。 随时间追踪同一时期获得的 customer groups,观察它们的 retention、revenue 和 gross margin 如何演化。对 AI-native 公司,需要明确拆分 customer behavior 和 model-cost decay。(见 Approach 8。)
Compute COGS。 流入 cost of goods sold 的 compute 成本(foundation-model API calls、GPU rentals、inference infrastructure)。对 AI-native 公司通常是 revenue 的 20–60%。(见 Approach 7。)
Compute concentration risk。 集中在单一 foundation-model provider 上的 compute spend 百分比。高 concentration 会产生传统 SaaS 没有的 vendor risk。(见 Cross-cutting concepts。)
Contribution margin。 Revenue 减去所有 variable costs(compute COGS、payment processing、hosting、customer-success time)。最重要的 per-customer profitability metric。
Deferred revenue。 已收款(或已签约)但尚未按 GAAP 确认的 revenue。对有 prepaid contracts 和 outcome-based pricing 的 AI-native 公司很常见。
Forecast accuracy。 Forecasted revenue 与 actual revenue 的历史匹配程度。衡量 finance-team predictive maturity。
FP&A (Financial Planning & Analysis)。 负责 forecasting、budgeting 和 strategic financial analysis 的 finance function。通常不同于 accounting(记录已发生的事)和 treasury(管理 cash)。
Gross margin。 Revenue 减去 cost of goods sold,并以 revenue 百分比表示。最重要的 profitability metric。AI-native norms:50–70%;传统 SaaS norms:75–85%。
GRR (Gross Revenue Retention)。 来自 existing customers 的 recurring revenue 保留百分比,不包含 upsell。总是小于或等于 100%。
Hybrid pricing。 组合两个或更多 components 的 pricing architecture(例如 subscription + usage overage)。它是 2026 年 $10M+ ARR AI-native 公司中的主导 architecture。(见 Approach 5。)
LTV (Lifetime Value)。 一个客户在其客户生命周期中预计产生的 total gross-margin contribution。
LTV/CAC ratio。 Customer lifetime value 与 customer acquisition cost 的比率。健康 SaaS programs 目标为 LTV/CAC > 3。
Magic Number。 一个季度新增 ARR 除以前一季度 sales-and-marketing spend,是 SaaS investors 推广的 efficiency metric。高于 1.0 属于健康。
Model-cost decay。 Foundation-model prices 每年下降 30–60% 的现象,会为 AI-native 公司产生 structural margin tailwind。(见 Approaches 8 和 10。)
NRR (Net Revenue Retention)。 来自 existing customers 的 recurring revenue 保留百分比,包含 upsell。高于 100% 表示 existing customer base 的收入在增长。
Outcome attribution。 证明哪些 outcomes 由 AI 交付的技术 infrastructure,用于支持 outcome-based revenue recognition。(见 Approach 3 和 Sales Catalog Motion 9。)
Per-call pricing / Usage pricing。 一种 pricing architecture,客户按 API call、token、每秒 audio 或 query 付费。AI infrastructure 的主导模型。(见 Approach 2。)
Per-outcome pricing。 一种 pricing architecture,客户只在 AI 交付定义明确的结果时付费。有时称为 "Service-as-Software"。(见 Approach 3。)
Per-seat pricing。 一种 pricing architecture,客户按每位用户支付固定费用。传统 SaaS 标准,在 AI-heavy products 中越来越不合适。(见 Approach 1。)
Pilot。 一个短期 paid engagement(通常 90 天,金额为 projected production contract size 的 10–25%),用作 enterprise AI sales 的 entry mechanism。(见 Approach 9 和 Sales Catalog Motion 7。)
Pilot-to-production conversion rate。 转成 production contracts 的 pilots 百分比。成熟公司通常为 50–75%。(见 Approach 9。)
Prepaid compute commitment。 对 foundation-model provider 的合同承诺,以固定 compute volume 换取折扣 pricing。在 balance sheet 上作为 prepaid asset,随着 consumption 计入 COGS。
Predictability。 Forecast accuracy。五个 financial pillars 之一。
Revenue recognition。 Revenue 何时进入账本的会计问题,受 ASC 606(美国)或 IFRS 15(国际)管辖。(见 Approach 6。)
Runway。 见 Cash runway。
SaaS metrics。 Recurring-revenue business 的 canonical metrics 集合:ARR、NRR、gross margin、CAC、CAC payback、LTV、Burn Multiple、Magic Number。适用于 AI-native 公司,但必须补充 AI-specific metrics。(见 Approach 12。)
Service-as-Software。 Outcome-based AI pricing models 的标签。在多数用法中与 Per-Outcome Pricing 同义。(见 Approach 3。)
Synthetic cost baseline。 一个 customer cohort 如果按 original-acquisition-period prices 服务会产生的成本,用来把 cohort margin trends 分解为 behavior change 和 compute-price decay。(见 Approach 8。)
Tier 1 / Tier 2 / Tier 3 metrics。 AI-native 公司 investor reporting 的 reporting framework,用来区分 canonical SaaS metrics(Tier 1)、AI-specific metrics(Tier 2)和 strategic context(Tier 3)。(见 Approach 12。)
Variable consideration。 ASC 606 下,合同 transaction price 中取决于不确定 future events(usage、outcomes、milestones)的部分。必须估计,并约束在 reasonable reliability 范围内。(见 Approach 6。)
Value-based pricing。 一种 pricing architecture,按已衡量 customer value created 的百分比收费。(见 Approach 4 和 Sales Catalog Motion 10。)
Notes
¹ Bessemer Cloud Index 和 Bessemer Venture Partners 在 cloudindex.bvp.com 上的研究追踪 public-cloud-software gross margins 和 metrics;他们关于 AI-native company economics 的文章,是 compute-classification practices 的关键公开来源。
² Andreessen Horowitz 的 growth team,尤其是 Sarah Wang 和 Shangda Xu 关于 AI margins 和 unit economics 的写作,在 2024–2026 年关于 AI-native companies 的 cohort-margin dynamics 和 compute-cost decay 上一直是重要声音。
³ Matrix Partners 的 David Skok 在 forentrepreneurs.com 发布了 foundational SaaS-finance framework;他的工作仍是 AI-native finance 所建立的 SaaS metrics 的 canonical reference。他关于 Burn Multiple、Magic Number 和 CAC payback period 的写作支撑了 Tier 1 metrics framework。
⁴ Tomasz Tunguz 在 tomtunguz.com 的写作以及 Theory Ventures research,持续成为 2024–2026 年 AI-native finance benchmarks 和 trends 的来源。
⁵ Point Nine Capital 的 Christoph Janz,尤其是他的 "5 Ways to Build a $100M Business" framework,提供了 AI-native pricing 所扩展的 SaaS-revenue-architecture foundation。
影响本目录的其他参考和来源包括:David Sacks 关于 Burn Multiple 的观点;Patrick Campbell 在 Profitwell 关于 pricing strategy 的工作;FASB ASC 606 documentation;AICPA technical advisory committees 关于 software companies revenue recognition 的工作;以及 Big Four firms 中有 AI 经验的 revenue accountants 在 outcome-based 和 value-based contracts 上 developing audit-defensible practices 的工作。